
📺Watch the full video here:
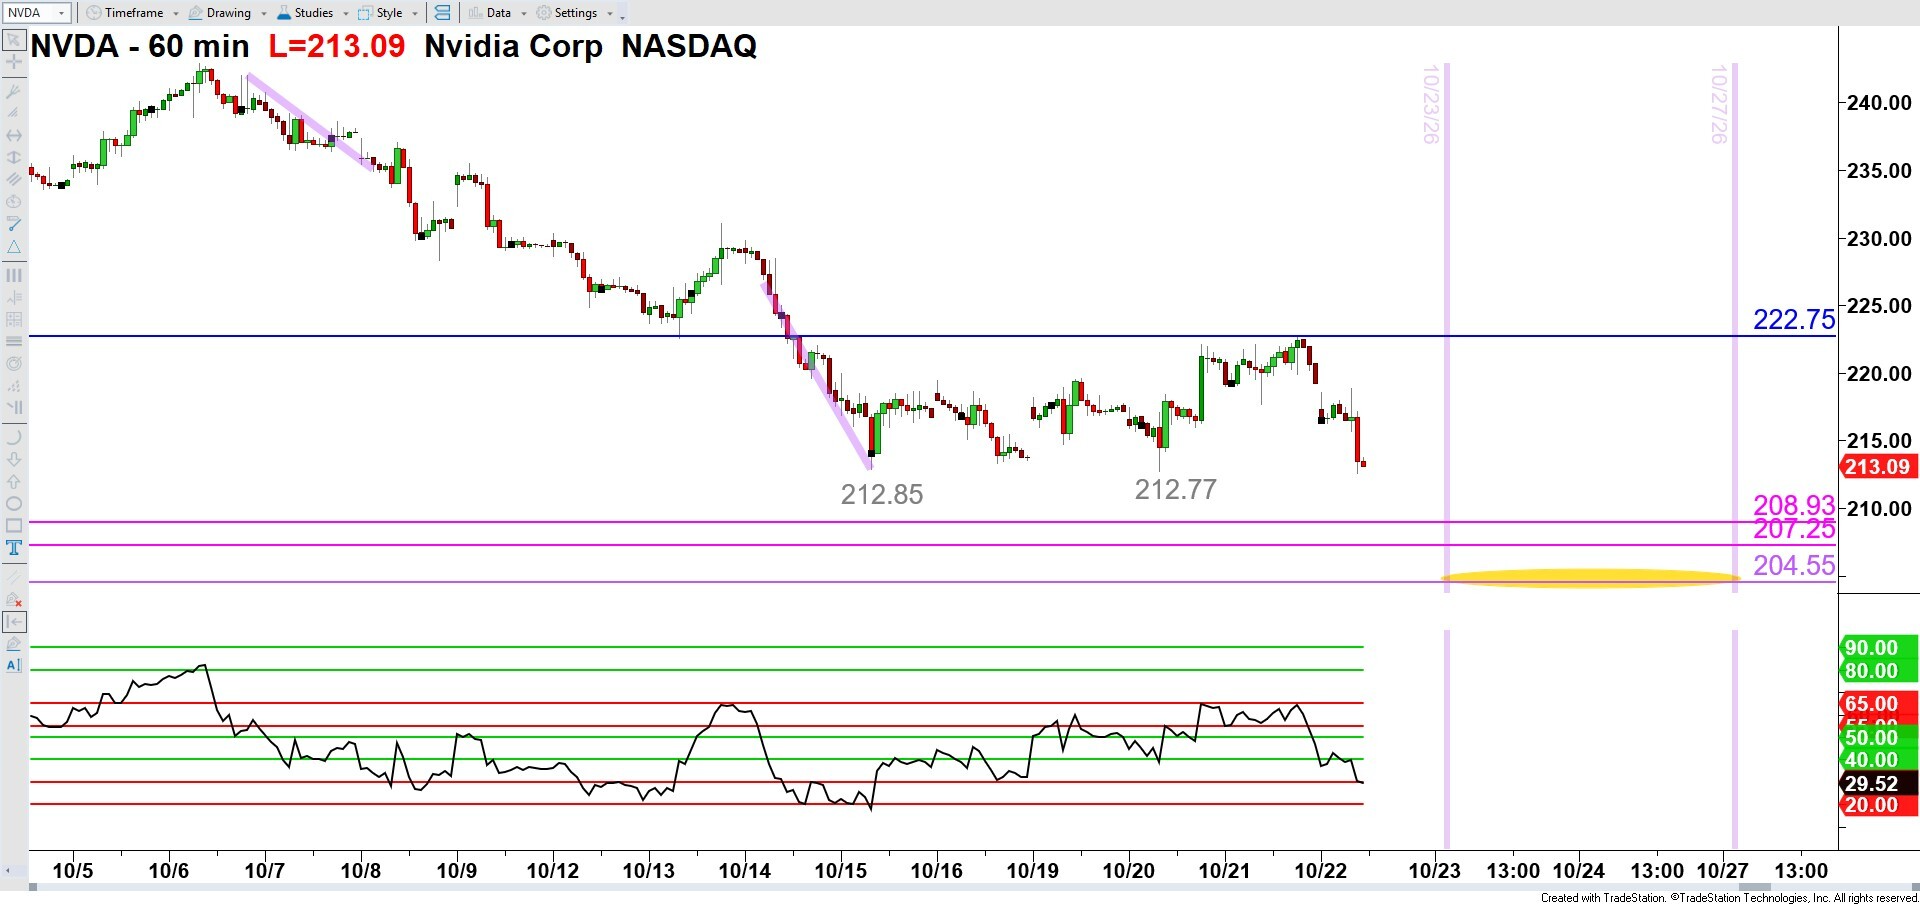
Support becomes resistance. Resistance becomes support. Most traders know that.
But understanding why it happens is what actually builds confidence when you’re looking at your charts.
What Support and Resistance Really Represent
As price is moving, especially in an uptrend, you’ll see areas where the market pauses and holds before continuing.
Those are your support levels — what I call price floors. It’s where buyers step in and hold the market up, even if it’s just temporarily before the next move.
On the flip side, resistance is where the market struggles to move higher, where sellers step in and cap price.
So when you’re marking support and resistance on your chart, you’re identifying where traders, in all their different forms, have already made decisions.
When a Support Level Breaks and Gets Tested
As that uptrend continues, eventually you’ll get a point where one of those support levels doesn’t hold anymore.
That’s the first thing that has to happen.
Sometimes the break is very clear — a strong move straight through the level. Other times, it’s more subtle. Price might dip below, come back up, and spend some time moving around that area before finally breaking.
Once price stops holding above that level, that support has been violated.
After that happens, you’ll often see price come back to that same level. That’s what I mean by a test.
A test doesn’t mean price has to hit the level exactly. Sometimes it’ll go slightly above it, sometimes just below. What matters is how price behaves there.
You’ll often see price push into that area, form upper shadows, and then fail to close above it.
The Real Reason the Flip Happens
This is where the psychology comes in, and it’s actually very simple.
Let’s say you were a buyer at that support level. The market moved up, but you didn’t get out of your long position in time. Then the price action reverses lower and drops below your entry level, and now you’re sitting in a losing trade.
At that point, hope enters the scene. Your focus shifts to getting out with as little damage to your trading account as possible.
So when price comes back up to that same prior support level, you take that opportunity to sell to exit and get out close to breakeven.
That behavior — repeated across many traders — creates selling pressure at that level. What was once support has become resistance.
Why the Level Keeps Getting Respected
And it’s not just one trader reacting like that — it’s a lot of them.
You’ve got traders trying to exit losing positions, new traders stepping in on the short side, and algorithms reacting to that same price zone.
So even if price moves slightly above or below the level, if it can’t hold there, that level continues to act as resistance.
That’s why you’ll often see price come back and test that same area multiple times before the next move develops.
The Same Logic Works in Reverse
The exact same thing happens the other way around.
If you have a resistance level and price breaks above it, then comes back down to test it, the behavior is similar — just flipped.
Traders who missed the move want to get in, traders who were short want to get out, and buyers step in at that level.
So what used to act as a ceiling can start acting as a floor.
Putting It All Together
So when you see a level break, and then price comes back to it, you’re watching how traders respond to that level — where they got in, where they got stuck, and how they react when they get another chance.
Once you start to see that clearly, it becomes much easier to trust the support and resistance levels you’re identifying.
If you’re found value in this breakdown, go ahead and watch the full video and hit the Like button on Youtube.
🚨 PS — Weekly Trading Show TOMORROW 🚨
Be sure to join me at Ticker Request Live for our 17th broadcast on Tue May 5th at 4:30 PM ET!
👉 You can register here to join me in the Zoom room: himareddy.com/tickerrequestlive
📺Or catch the livestream here: https://www.youtube.com/@himareddycmt/streams
Check out ALL of our events at himareddy.com/events!

Leave a Reply