
One of the first things traders learn in technical analysis is how to draw a trendline. That’s a valuable skill, but there’s another lesson that doesn’t get nearly as much attention: knowing when a trendline has stopped being useful.
I see charts all the time that are filled with trendlines drawn weeks or even months ago. At some point, those old lines stop helping your analysis and start competing with the information that’s actually relevant today.
A trendline has a job to do. Once it stops doing that job, it’s time to reevaluate it.
Trendlines Have a Lifespan
A trendline is simply showing you a projected angle of buying or selling pressure based on existing price action. As long as price continues respecting that angle, the line gives you useful information about potential support or resistance.
Markets don’t move the same way forever, though. Trends speed up, slow down, consolidate, and sometimes change direction altogether. As price evolves, your trendlines should evolve too.
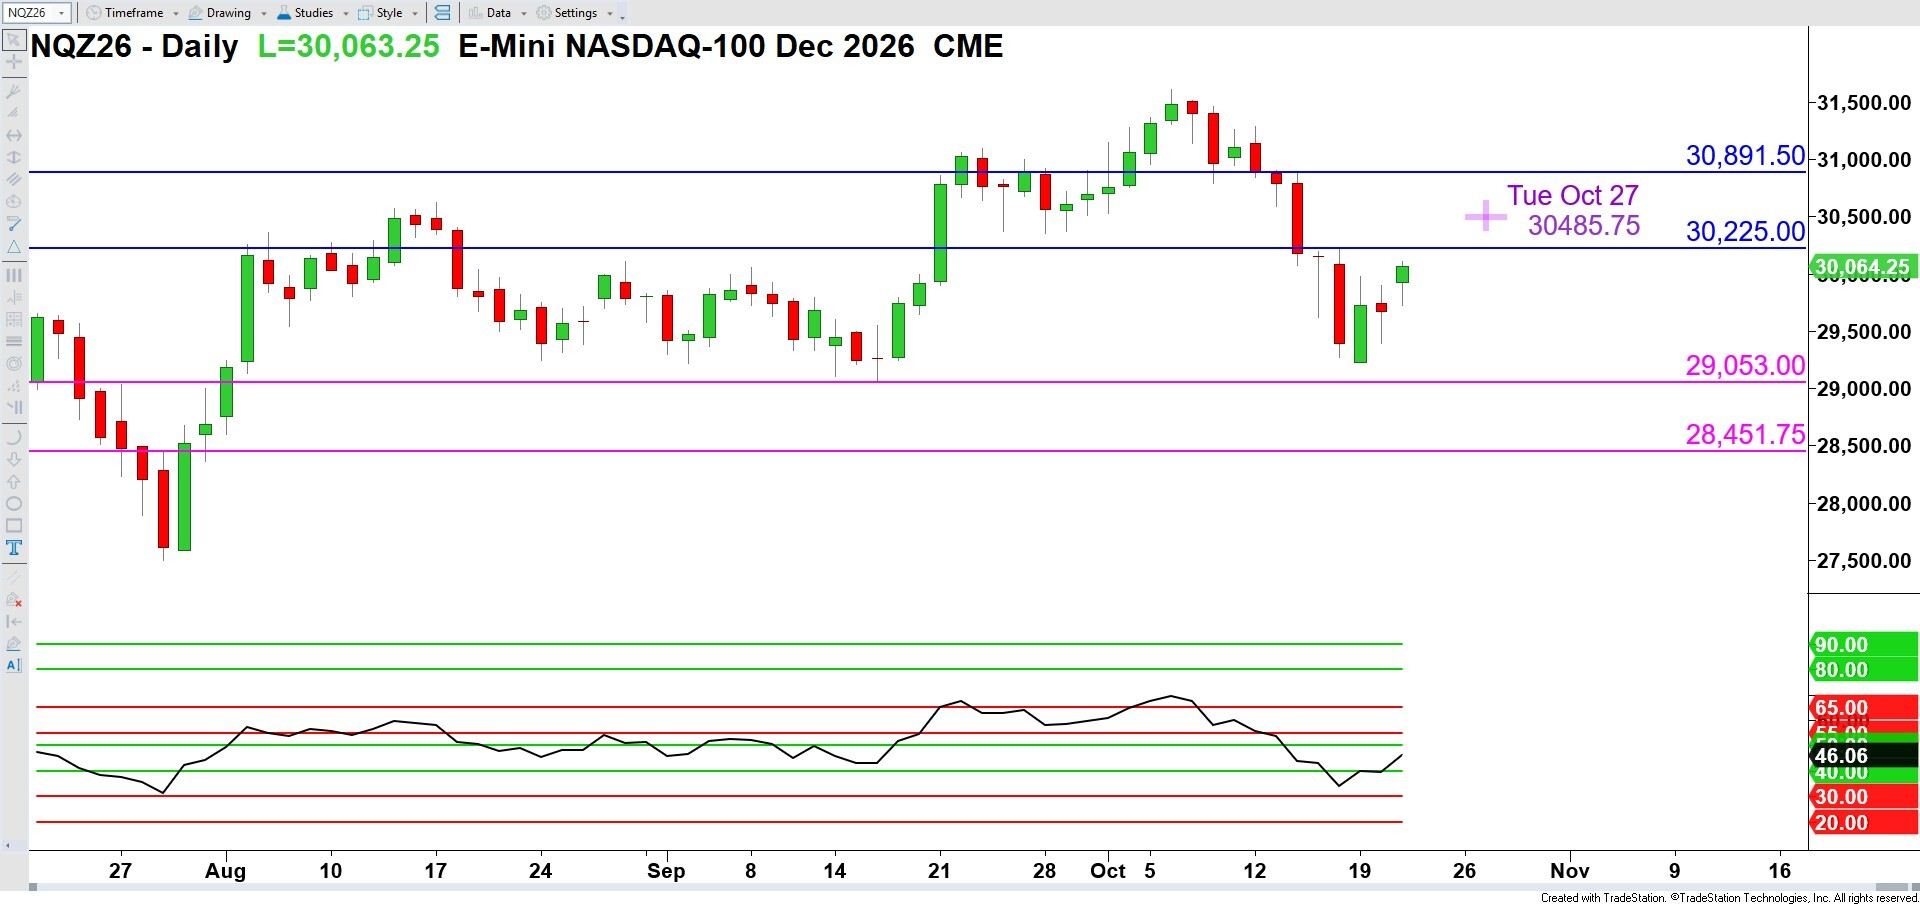
During a recent Ticker Request Live, we looked at ticker NQ, Nasdaq futures (April 28 2026) and a trendline that had been very useful earlier in the move. It connected the late March and early April lows beautifully and helped frame the rally.
Then the market changed.
Watch How Price Interacts With the Line
One of the first things I watch for is whether price is still respecting the trendline.
In the Nasdaq example, the market didn’t simply touch the line once and bounce. Instead, it began trading above the trendline one day and below it the next. That happened over multiple sessions.
When the daily highs and lows keep crossing back and forth through a trendline, I start questioning how much weight it deserves. The market is telling me that particular angle isn’t carrying the same significance anymore.
That’s usually my cue to make an adjustment.
You Don’t Always Have to Delete It
Sometimes I remove a trendline completely.
Other times I’ll change the solid trendline to a dotted line, or fade it into a gray color. That tells me it was important at one point, but it isn’t one of the primary decision-making tools on my chart anymore.
If a new projection or resistance level later lines up with that same angle, I can always give it more attention again.
The point is to let your chart reflect what the market is doing today, not what it was doing several weeks ago.
Distance Matters Too
Later in that same session, we looked at QBTS (D-Wave Quantum) and found another example of this at play.
There was an older support trendline that had worked well during an earlier consolidation. By the time we were reviewing the chart, price had moved so far away that the trendline no longer had much practical value.
Technically, the line could still be considered correct.
From a trading standpoint, though, it wasn’t helping me make better decisions because it was so far removed from the current price action.
That’s another situation where I’m perfectly comfortable removing a trendline. I’d rather focus on what the market is doing now than keep a chart full of historical reference points that no longer influence my analysis.
A Cleaner Chart Is Often a Better Chart
It’s easy to become attached to chart work you’ve already done. After all, you spent time identifying those swings and drawing those lines.
But the market doesn’t know (or care about) how long ago you drew them.
As new price action develops, some trendlines naturally become less important while others take their place. Keeping your chart updated makes it easier to focus on the areas that deserve your attention right now.
That doesn’t mean you need to erase everything every few days. It simply means being willing to adjust your chart as the market gives you new information.
Final Thoughts
Trendlines are one of my favorite tools because they can quickly show the rhythm of a trend.
Like any tool, though, they work best when they’re current.
Every so often, take a fresh look at the trendlines on your chart. Ask yourself whether price is still respecting them, whether they’re still close enough to today’s action to matter, and whether they’re contributing something useful to your analysis.
Sometimes the best thing you can do for your chart is remove a line that has already served its purpose.
🚨 PS — Watch the Full Replay: Last Night’s Weekly Trading Show
We had our 25th broadcast of Ticker Request Live yesterday!
📺Catch the complete July 7th replay on Youtube (will come down without notice):

Leave a Reply