
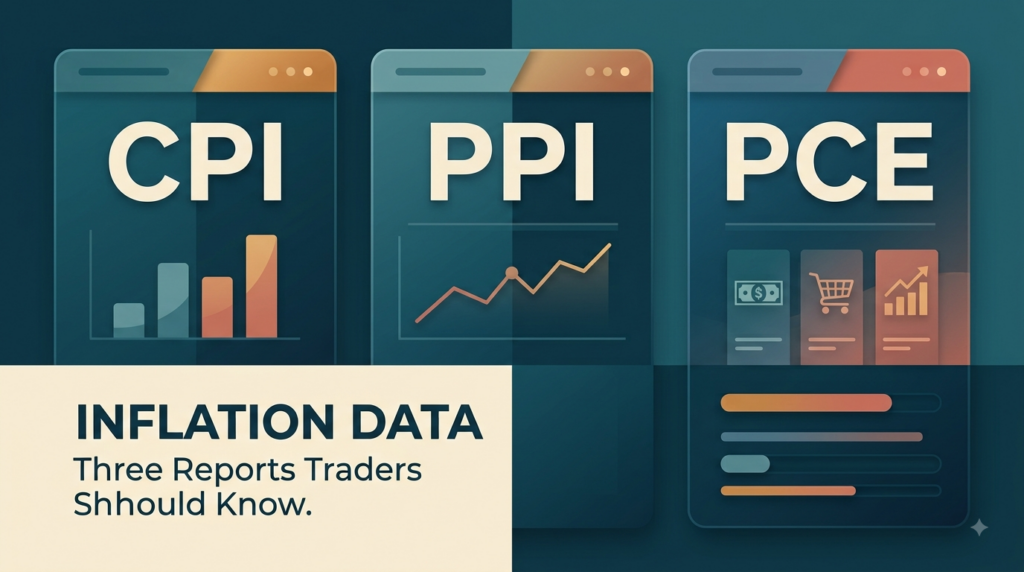
When it comes to trading, every week there’s a calendar full of economic data that you could pore over to help make better trading decisions or simply be prepared for potential market volatility.
One of those categories is inflation. It refers to the rate at which the prices of goods and services are increasing. Let’s look at three key inflation markets and how they tie into your trading, no matter what markets you trade or what time frames you trade.
CPI: Consumer Price Index
The Consumer Price Index, or CPI, measures changes in the prices consumers pay for a broad basket of goods and services such as housing, food, transportation, and medical care. It gives us a major read on whether inflation is heating up or cooling down.
Because inflation influences Federal Reserve interest rate policy, a surprise in CPI can rapidly change expectations for rates and move the broad stock markets like the S&P 500.
CPI is released monthly, generally during the following month at 8:30 a.m. Eastern. The exact dates vary by month, so you can keep tabs on the schedule through the U.S. Bureau of Labor Statistics (https://www.bls.gov/) or an economic calendar like Forex Factory (https://www.forexfactory.com/calendar/).
The other thing I want you to think about is the market impact. If the CPI numbers come out beyond what was expected, whether worse (hotter inflation) or better (cooler inflation), that can really fuel stock moves. So it’s always important to know when this information is about to be released, especially if you are a day trader or scalper. It’s generally on a Tuesday at 8:30 AM ET, always check the calendars to know for sure. .
PPI: Producer Price Index
PPI is different because it measures inflation from the producer’s perspective before focusing on prices paid by consumers. It can provide clues about inflationary pressure moving through the economy.
Rising producer prices can eventually contribute to higher consumer prices and influence expectations for Federal Reserve policy.
Remember this, though: a higher PPI isn’t automatically bearish, and a lower one isn’t automatically bullish.
The reaction of the market depends heavily on what the market expected and whether traders are currently more concerned about inflation versus interest rates or broader economic growth.
PPI is also released monthly by the U.S. Bureau of Labor Statistics, generally on the Wednesday after CPI, again at 8:30 AM ET.
PCE: Personal Consumption Expenditures → Fed Favorite
Last but not least is PCE, or Personal Consumption Expenditures.
The Core PCE Price Index is the Federal Reserve’s preferred inflation gauge. It measures monthly price changes for consumer goods and services, excluding food and energy, to help show underlying inflation trends.
A higher reading may lead market participants to expect tighter monetary policy, while lower inflation readings can ease some of the pressure on interest rates.
Again, a lot of the market reaction comes down to how participants believe the Fed will read that PCE number.
PCE is also reported monthly, but by a different agency, the U.S. Bureau of Economic Analysis (https://www.bea.gov/).And even though CPI tends to get more media coverage, Core PCE carries more weight with the Fed.
So keep tabs on this one for sure. It usually reports later in the month a couple weeks after CPI and PPI. As of this blog writing, it’s scheduled for Wednesday August 26th at (drumroll please) 8:30 AM Eastern.
Now that you have these three metrics, what they measure, and why markets pay attention to them, you’ll be better set to navigate the inflation data that comes your way in your trading!
🚨 PS — Watch the Full Replay: Last Night’s Weekly Trading Show
We had our 30th broadcast of Ticker Request Live yesterday!
📺Catch the complete Aug 11th replay on Youtube (will come down without notice):

Leave a Reply