
The 10-year Treasury yield has hit its highest level since 2007 as traders get ready for tomorrow’s (September 16) Fed meeting announcement, which is likely to include a rate hike.
And the best place to start with what that actually means for your personal trading is with a quick blast to the past.
Start With the Monthly Chart
Having context around the 5% level when it comes to 10-year Treasury yields really helps. And the best place to get that context is a higher-timeframe chart.
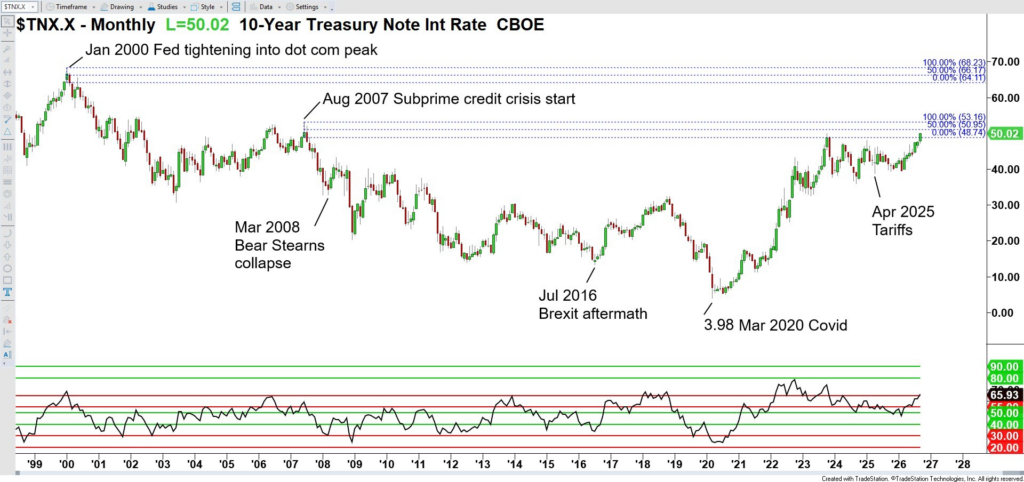
Here we have the monthly chart of $TNX.X. This takes the 10-year Treasury yield and multiplies it by 10. So when you look at the current price action on the hard right edge of the chart, you can see the intra-month action trading above the 5.00% level because on this chart, that shows up above 50.00.
If you’re newer to trading or haven’t really been paying attention to yields, I think it’s very helpful to take note of the historical points on this chart.
I’ve marked some of the major market turns and their related economic or financial events.
Look Back Further Than 2007
You can see that we’re returning to the levels where yields were back in August 2007, when the subprime credit crisis began.
That was followed by the 2008 financial crisis, kicked off by the Bear Stearns collapse in March 2008.
That’s still only part of the yield story.
If you’ve been trading for less than 20 years, you may not even have been trading in an environment where yields on the 10-year were above 5.00%.
So I want you to be aware of the period before August 2007. Take a look back to January 2000, when the Fed, led by Alan Greenspan, was tightening (raising interest rates) into the dot-com peak.
Mapping Help To Make More Sound Analysis
When you have this monthly chart in front of you heading into a Fed meeting, the point is to have these levels “mapped” on your chart and know where you are relative to the history of whatever you are trading.
And this 10-year yield surge up above 5.00% really wasn’t a surprise to me.
In fact, at our Monthly Group Coaching session last Wednesday, I conducted analysis and shared “My opinion is that the 10-year goes up to 5.00% before it comes back to 4.00%. I’m not saying it goes to five and drops four, I’m just saying I would more be expecting it to trade up to five. “
And that’s exactly what unfolded over the past several sessions.
Yields Beyond the Fed
I’ll follow up this week with breakdowns of other timeframe charts, bringing us more narrowly into the action. That will be especially useful once we see what happens after tomorrow’s Fed announcement.
And where yields are headed from here will not only be fueled by tomorrow’s Fed action, but also words they share in the FOMC statement and during the Fed Chair Warsh’s press conference.
For now, I think it’s important for you to get their bearings on recent history, see where things have played out, and be ready for a higher interest rate environment and the effects it may have on the markets you trade.
👉 PS — Gann Trading Patterns LIVE Reboot Continues This Week!
If you’re a Gann Trading Patterns System member, I’m teaching the System LIVE via Zoom this week, and we still have two sessions to go.
I’ll be bringing in developments I’ve made to the strategies since I first taught the System in 2020, and you’ll also have the chance to ask your questions live.
● Session #2: Wednesday Sep 16 at 4:30 PM ET
● Session #3: Thursday Sep 17 at 12 PM noon ET
Zoom links will be going out to members via email.
Check out ALL of our events at himareddy.com/events

Leave a Reply