Lions and tigers and bears, oh my!
That’s honestly what it can feel like when you first come into trading and start hearing about all the digital tools that can help you.
And I’m not just talking about the charts themselves. I mean the tools that go beyond the chart to help you find opportunities and monitor the market. If you’re newer to trading, those words can start sounding interchangeable pretty quickly. So let’s simplify them.
What Is an Indicator?
An indicator is generally a tool you place onto a specific securities chart — a stock, futures market, commodity, or another market you’re watching.
The indicator measures some type of market data.
That could include:
- Volume — the amount of trading activity taking place
- Momentum — the speed at which price is changing
- Sentiment — how traders are feeling about the market
Then it visually plots that information onto the chart for you.
So instead of only looking at candlesticks and price action, you’re also able to evaluate additional market information at the same time.
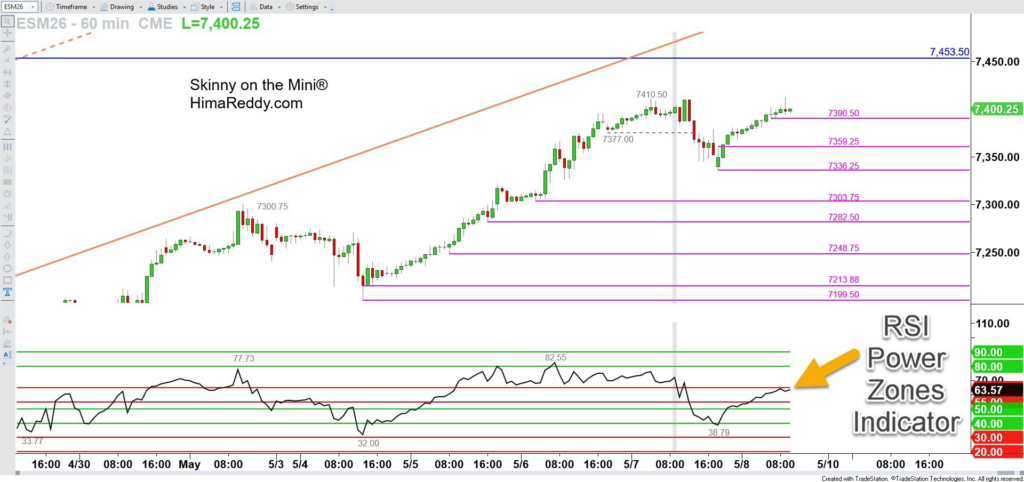
If you’ve spent even a few minutes around my work, you probably already know my favorite indicator is RSI Power Zones.
It measures momentum and goes beyond traditional RSI to help traders evaluate different kinds of market conditions — whether the market is strongly trending or moving sideways.
Here’s an example of the RSI Power Zones Indicator on an ES futures chart:
What Is an Alert?
To clarify for more advanced traders, I’m not talking about “trade alerts” here. I’m talking about the technological alert function available inside charting platforms.
Let’s say you’re watching a stock and you want to know when it trades up to a certain price.
You can place an alert at that level.
Then your platform can:
- Send a pop-up
- Play a sound
- Send a text
- Or send an email
In other words, the platform notifies you when price reaches the level you care about.
I use alerts heavily in my own trading, especially because I trade intraday.
For example, I’ll often place an alert directly onto a horizontal price level I’m monitoring on my live 3-minute ES futures charts.
That way, if price reaches the level, I’ll hear an audible ding on my computer and can quickly come back to the chart to evaluate whether there’s a setup worth trading.
It helps me avoid staring at the screen nonstop all day.
What Is a Scanner?
A scanner is different because it looks across a much larger group of securities.
Most scanners evaluate hundreds or even thousands of stocks, ETFs, futures markets, or other instruments at once.
The scanner is programmed with specific criteria.
For example:
- Momentum conditions
- Indicator readings
- Price action behavior
- Trend conditions
- Volume conditions
Then the scanner searches for setups that match those conditions.
Instead of manually flipping through hundreds of charts yourself, the scanner quickly tells you which markets are currently showing the setup you’re looking for.
Scanners can be especially useful for traders who are:
- Swing trading stocks
- Monitoring large watchlists
- Looking for opportunities across many charts
The important thing is that the scanner should ideally be based on criteria you already understand and trust.
The scanner speeds up the process of finding setups, but you still want the education behind why those setups matter.
Final Thoughts
Especially if you’re newer to trading, hearing terms like indicators, alerts, and scanners can feel a little overwhelming at first.
But once you separate what each tool actually does, it becomes much easier:
- Indicators help measure market behavior
- Alerts notify you when something important happens
- Scanners search through large groups of charts for opportunities
And yes — these kinds of tools are absolutely on my radar as well.
I’m always interested in helping traders not only improve their chart analysis skills, but also become more efficient with their time.
What we have coming is designed to help move in that direction, so keep an eye on your email and future coaching sessions for more updates.
👉 PS — Trader Trainings Next Week!
The Trader Training calendar has been updated! Here’s what’s on deck:
- Ticker Request Live — free weekly trading show
📅 Tuesday, May 12th at 4:30 PM ET - First 40 Trading Club Office Hours for course members
📅 Wednesday, May 13th at 4:30 PM ET
Visit himareddy.com/events for full details and registration.


Leave a Reply