Price Action is one of the most foundational concepts in technical analysis—and one of the most powerful tools a trader can master. Rather than relying solely on additional chart indicators, price action puts the raw market movement front and center, allowing you to read the market like an experienced pro.
In this follow-up to our recent blogpost “Mastering Price Action: How to Read the Market Like a Pro”, we’re breaking down four distinct forms of price action, each offering a different lens through which to view and analyze the market. By the end, you’ll understand how to apply these layers to boost your trading strategy—whether you’re a beginner or more advanced!
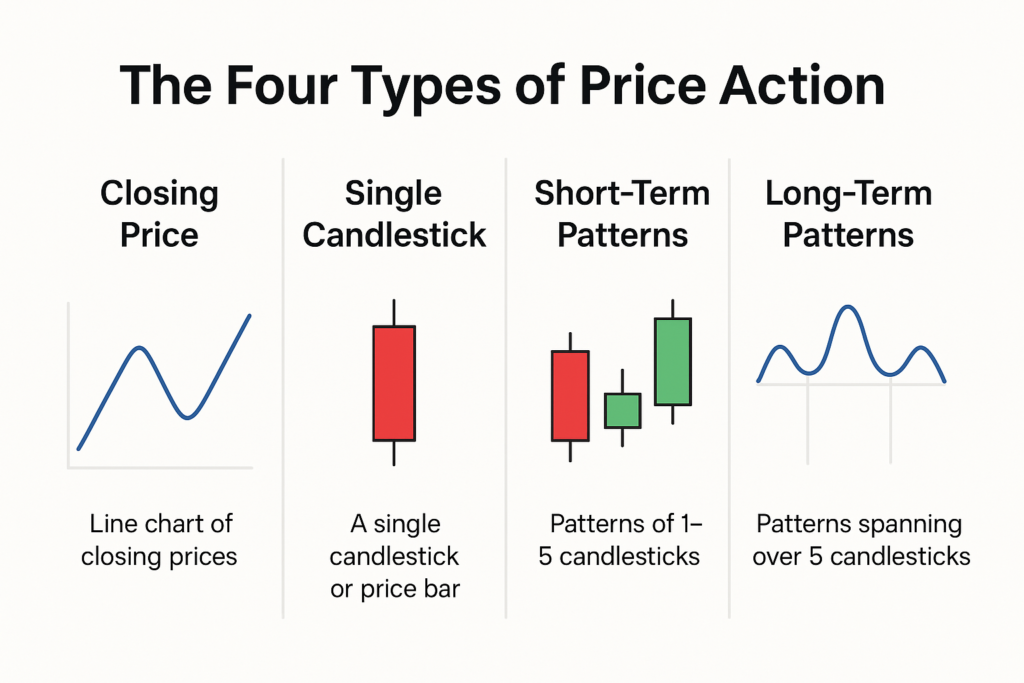
1. Closing Price – The Market’s Final Word
The closing price of any trading session is often considered the most important data point. It reflects the final consensus of value between buyers and sellers, and it’s what you’ll often see represented on a line chart.
Line charts are commonly used in reporting economic or index data, such as the S&P 500’s end-of-day values. They’re straightforward and clean—but their simplicity is both a strength and a limitation. Relying on closing prices alone gives a very limited view of the story behind each individual session of trading.
📉 Use Case: Line charts are useful for spotting broad trends or macro direction, especially over longer timeframes.
2. The Single Candlestick or Price Bar – A Session’s Story in One Glance
A candlestick chart reveals much more than a simple closing value. It shows the open, high, low, and close for any timeframe—be it a day, week, or even one minute.
Each candlestick (or OHLC bar) tells a compact story: Was the session bullish or bearish? Was there indecision? These visual clues, especially when color-coded (green for up candles, red for down candles), allow traders to react more quickly to market sentiment than just closing price data alone.
Some common single-candle patterns include:
- Hammer (bullish reversal)
- Shooting Star (bearish reversal)
- Doji (indecision)
🕯 Pro Tip: Mastering these single candlestick patterns is a foundational skill in technical trading—and a great place to start if you’re new to price action.
3. Short-Term Patterns (2–5 Candles) – Catching Moves Early
Once you’re comfortable interpreting single candles, the next step is identifying short-term candlestick patterns. These typically span 2–5 candles and are excellent for spotting reversals or continuations in price trends.
These formations give deeper insight into how price may behave next. For example:
- Engulfing Pattern – Strong reversal indicator
- Morning Star / Evening Star – Indicates potential trend shifts
- Harami – A sign that the current price trend may be slowing
We lightly introduce these concepts here, but we go deeper inside the Gann Candlesticks Trading System.
📈 Insight: These patterns help reveal the “tug-of-war” between buyers and sellers on a short-term scale—and can lead to high-conviction entries.
4. Long-Term Patterns (Over 5 Candles) – Seeing the Bigger Picture
Some price action patterns evolve over days, weeks, or even months. These long-term formations include Head and Shoulders, Double Tops/Bottoms, and Triangles—and they can reveal powerful trend shifts or setups for large moves.
These multi-candle patterns take patience to spot and confirm but can give incredibly strong directional clues. They’re especially useful for swing traders or position traders looking to time longer-term entries.
This is also where Gann techniques come in. Using time and price relationships, Gann analysis helps refine how and when to act on these larger formations. We dive deeper into these patterns in the Gann Trading Patterns System.
⏳ Tip: Long-term price patterns help pro traders better understand market psychology and time trader entries and exits with greater confidence.
Bringing It All Together – Your Price Action Snapshot
Now that you know the four key forms of price action, it’s time to apply them strategically.
- Use closing prices and line charts for a high-level view.
- Read individual candlesticks to gauge short-term momentum.
- Spot short-term patterns for entries and exits.
- Watch for long-term formations to align with bigger market moves.
Every type of price action has value, but the real edge comes from knowing when and how to use each one in your analysis.
🎯 Start simple. Then layer on more advanced techniques as your confidence grows.
Want to Dive Deeper?
If you want to sharpen your skillset even further, we explore how to use these candlestick patterns inside our Gann Candlesticks Trading System—a powerful set of training with live coaching that blends classic chart reading with time-tested Gann strategies.
~Hima
📌 Stay Tuned: What’s Coming Next
If you missed our foundational post on price action, check it out here:
👉 Mastering Price Action: How to Read the Market Like a Pro
And stay tuned—this blog is part of an entire Price Action Series that will continue to break down advanced techniques, examples, and trading psychology so you can take your analysis to the next level.
Also, if you’re following our RSI Blog Series, be sure to visit:
📘 Understanding the Relative Strength Index (RSI): A Comprehensive Guide
2 responses to “Decoding Price Action: The Four Pillars of Market Interpretation”
-
Very interesting, want to master it
-
Info please
Leave a Reply