The S&P 500 has been on an overall trek higher since mid-April, when it bottomed after the initial tariff news hit. On the way up, we’ve had various trade-deal headlines, the latest being that there’s a deal framework with China that could be finalized by this Friday, September 19.
Before that though, all eyes are on the Fed. They wrap up their two-day meeting tomorrow, Wednesday, September 17. The expectation is for a rate cut.
The question isn’t just about the size of the cut. It’s about the Fed’s language — in the statement and in the press conference — that will give us insight into how they’re looking to meet their mandate for maximum employment and stable prices over time.
My Forecast
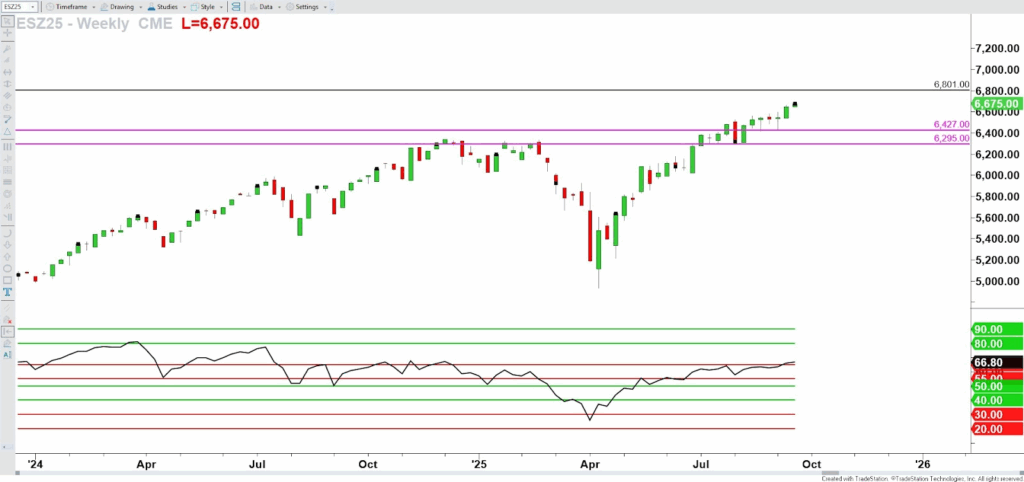
Now, where do I see the S&P 500 going? Looking at the E-mini S&P 500 futures (December contract) shared above:
You’ll see a horizontal line on this chart at 6801.00. That’s my next forecasted area, a potential major target. Call it 6800.00.
This comes from my Lost Forecasting techniques.
Here’s the kicker: we’re approaching this forecast level twice as fast as the forecast would normally suggest.
That means the rally off the April low has been twice as strong as normal market cycles would have set expectations for. So I believe we’ll actually get to 6800 within the calendar year — by the end of 2025.
Key Levels on the Way
Of course, the market doesn’t move in a straight line. We’ll see corrections and pullbacks along the way.
The most important near-term level to watch is 6427 — the low for the week ending September 5. That’s also the most recent Price low.
If you’ve been through my Four Zones RSI course or anything more advanced, you know I analyze price in three ways:
- Based on the single bar
- Based on the relationship between 3bars
- Based on the relationship between 5bars
Right now, it’s that 3-bar relationship — from the week ending August 29, to September 5, to September 12 — that’s keeping the uptrend intact.
If futures decline below 6427 before reaching 6800, the next immediate downside target would be 6295 (the low from the week ending August 1). From there, I’d have to reassess.
Putting It Together
So that’s the picture:
- 6800.00 by year-end is the big upside target
- 6427.00 is the near-term line in the sand
- 6295.00 is the next support if that line breaks
If you trade ES, MES, SPY, or even international S&P equivalents and you want to know my day to day take on this, I share that in my research reports in the S&P Edge Pro and I review these markets in our trading labs that we have as well.
And remember — this is my opinion, based on my tools, my study of momentum, and my analysis of price action. Don’t trade these numbers blindly. Use them to frame the bigger-picture trend while you navigate short-term moves.
~Hima
PS The Fed announcement may be tomorrow, but better yet is my BRAND NEW workshop this Thu Sep 18th at 4:30 PM Eastern for your Trading Plan Breakthrough! Tap here to register>>
One response to “A Look at the S&P 500 Ahead of the Fed”
-
Very useful analysis. Interesting to note these support levels correspond to 50% levels Thanks

Leave a Reply