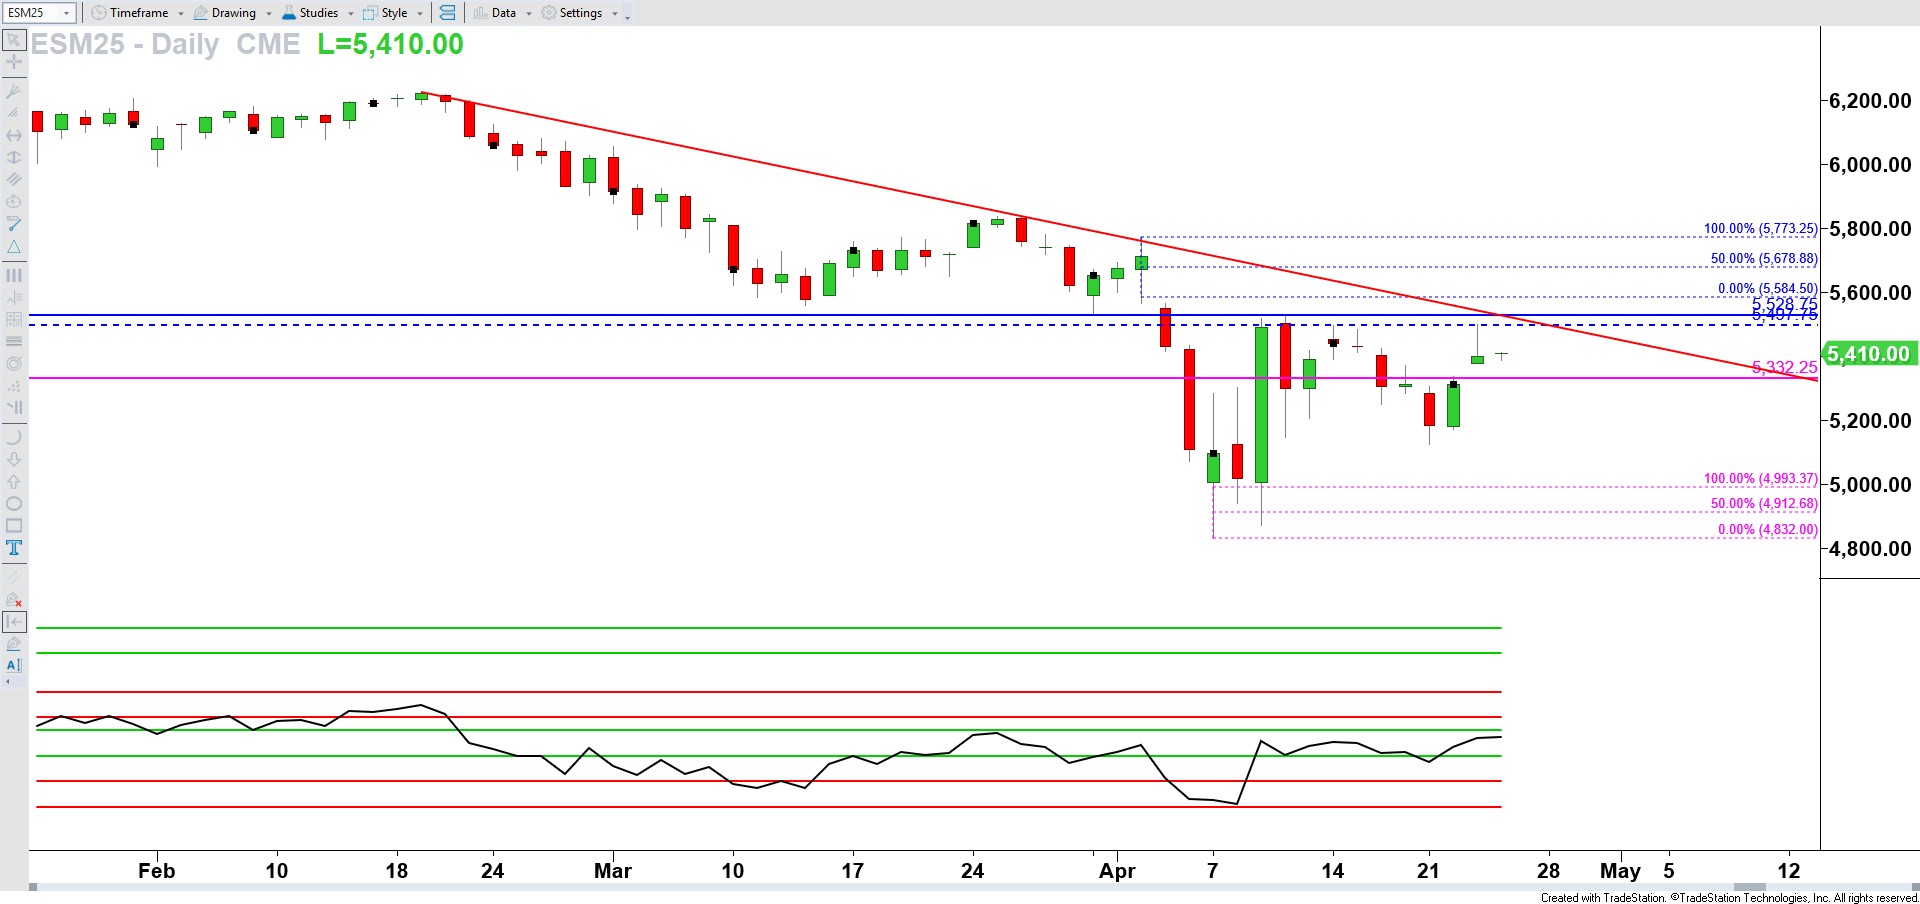
If you’re brand new to trading, or looking to reset your skills, you might feel like you’re starting kindergarten all over again. I get it, I've been there too!
Because whether you’ve come from a high-level career, an academic background, or just pure curiosity, the world of trading can feel overwhelming at first. This 5-step guide is designed to simplify the process and give you a clear formula to get started.
How do I know it works? Because it's essentially what my late father had me do when I was first learning from him as a teenager. Fast forward 25 years and now I'm teaching you.
These steps were inspired by a recent conversation I had with a beginner trader, and I thank him for his bravery and transparency. As I shared this process with him, I realized it could benefit everyone in our Tribe!
Step 1: Get Charting
To truly understand trading based on chart, you need to be able to view price action in real-time. Reading books or taking courses is helpful, but without live charting, your learning curve will be at a snail’s pace.
Recommended Platform:
- TradingView: It's a versatile and affordable platform with a free option. It’s web-based or downloadable, making it accessible for most traders. Even as an experienced trader using TradeStation, I’ve made it a personal goal to learn TradingView better this year because of its widespread use and innovative features. You can head right to their website or use this link to get started: https://www.tradingview.com/?aff_id=144015&aff_sub=himareddy
Step 2: Plot Your First Chart
Start simple: plot a daily chart of Apple stock
Why AAPL?
- It’s a tech stock with good movement to observe.
- Fundamentally strong (ie making $$$)
- Significant component of the S&P 500 index of over 500 of the largest U.S. stocks
- Provides more steady price movement (unlike something like Tesla that tends to gap a lot)
- It's not going away anytime soon (cough Iphones everywhere cough)
How to Start:
- Plot a chart of AAPL stock in TradingView
- Use TradingView’s resources or support desk if you need help creating the chart.
- Focus on the daily timeframe to begin with. Meaning every candlestick (the red and green bars) on the chart should each change from one date to the next meaning they are representing one day of price action.
Step 3: Install the RSI Power Zones Indicator (Optional)
If you’ve invested in my Four Zones RSI Coverage System, now is the time to start applying what it contains! Plotting the RSI Power Zones indicator on your AAPL daily chart enhances your learning by pairing theoretical knowledge with practical application.
Follow the instructions in the Four Zones RSI portal to install the indicator to your charts.
Step 4: Observe a Smaller Time Frame
After plotting your daily chart, immediately add a chart with a smaller time frame—I recommend the 1-minute timeframe.
Observation Exercise:
- Dedicate a 30-minute block during regular New York market hours (9:30 AM to 4:00 PM).
- Simply watch the Apple chart’s movement on the 1-minute timeframe, again ideally with the RSI Power Zones plotted as a sub chart (below the candlesticks, not on top of them).
- Do this for at least 10 sessions (2-3 weeks depending on market holidays).
- If you need to miss a day, that's OK, just pick back up as soon as you can.
This exercise isn’t about strategies or setups; it’s about developing an intuitive sense of market patterns and tendencies.
Think Mr. Miyagi to Daniel San — it's like the “wax on/wax off” exercises in the Karate Kid movie that seem mundane but have an end goal for true mastery.
Step 5: Combine Observation with Education
Now that you’ve spent time observing, integrate your learnings with educational resources.
How to Combine:
- Complete foundational education from any resource you’ve chosen (e.g., a module from the Four Zones RSI system, an e-book, or another trusted trading education provider resources).
- Continue observing the 1-minute chart for 30 minutes daily.
- Look for chart patterns, setups, or other insights that align with what you’ve learned. Take notes, do NOT take live money trades yet.
- Be sure to take notes on the details of what you observe AND what unfolds afterwards
- Ask questions of your peers in our various community features in our portals and Tribe and if you’re a course member ask me Hima directly at Monthly Group Coaching Live
Great for Advanced Traders Too!
While these 5 steps are tailored for beginners, they’re also a great reset exercise for experienced traders. If you’re looking to expand your skills or regroup after a string of losses, save this guide for a structured approach to recalibrating your trading.
And if you’re an experienced trader, consider sharing this guide with someone in your life who’s interested in trading—whether it’s your kids, spouse, or a friend. This step-by-step approach is a fantastic way to help them start their trading journey safely with clear simple action steps.
If you decide to give this a try, I’d LOVE to know, be sure to reply back and keep us posted!


Leave a Reply