Inauguration: we're about to have a new U.S. president who was also a former president, which is extremely rare and makes for an unusual transition.
Inflation: this week, we saw that producer prices (PPI) were lower than expected, showing inflation has slowed down. Consumer numbers (CPI) were on target.
Interest rates: And the first Federal Reserve FOMC meeting and announcement of the year is on Wed Jan 29th. We'll need to see how confident they are that their interest rate actions are bringing inflation back to their 2% goal. Because sure slowing inflation is good, but getting prices to stop rising is another story.
So while you stay focused on your markets of choice for actual trade setups, I advise keep tabs on the 10 year yield action. I specifically look at TradeStation symbol $TNX.X, the CBOE 10-year Treasury Interest Rate that is basically 10x the actual yield. For example, a reading of 46.57 means a 4.65% yield on a US 10-year bond.
Take a look at this monthly chart:
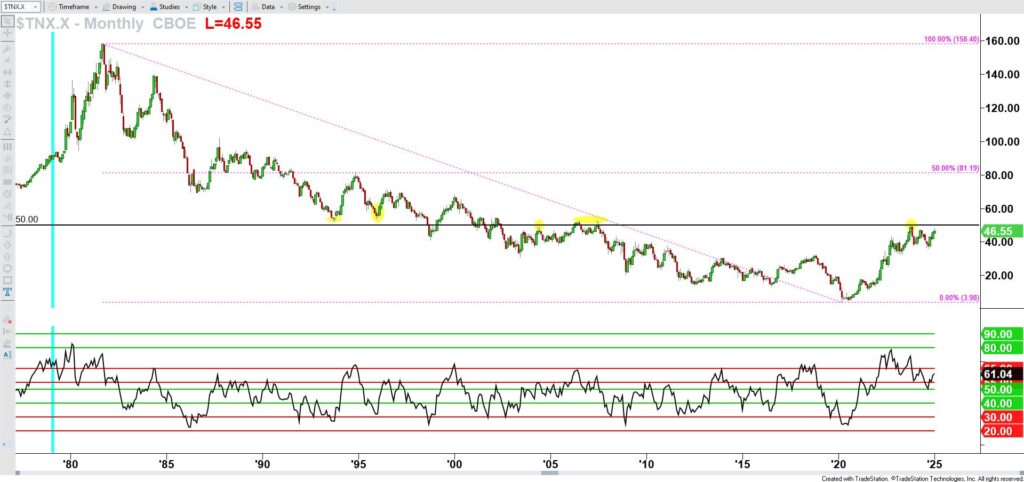
RIGHT CLICK CHART AND OPEN IN NEW TAB TO ENLARGE CBOE 10-Year Treasury Note Int Rate (TradeStation: $TNX.X) / MONTHLY Chart
The light blue vertical line marks February 1979, the month of my birth. It’s great for giving perspective on how much yields have moved up and down over the past 45+ years!
Notice the yellow highlights showing times since the mid-'90s when rates hit around 5.00%. This isn't just a random number; at 5.00%, bonds can become a more attractive investment vehicle than some stocks, causing demand for stocks overall to drop resulting in lower stock prices. The yellow highlights on the chart show past market reactions to this 5.00% level, the most recent being October 2023.
On the right side of the chart, you’ll see yields are on track to return to that 5.00% level, basically just consolidating over the past year. The RSI Power Zones (my favorite momentum indicator which I teach in my Four Zones RSI course) shows how yields worked off overbought conditions in October 2022, holding the Bull Support Power Zones since September 2024.
For more details on what might happen with the 10-year yield in the coming days and weeks, check out my detailed “Skinny style” report below. This style of reporting is similar to what I do for E-mini S&P 500 futures (ticker ES) and the S&P 500 SPDR SPY ETF weekly as part of my S&P Edge Pro research service.
No matter what you trade, keeping tabs on the interest rate environment is critical, and the 10-year yield is a great starting point for that. Dig into the Skinny below and let me know if it’s helpful!
Skinny On The 10 Year Yield: Wednesday January 15, 2025
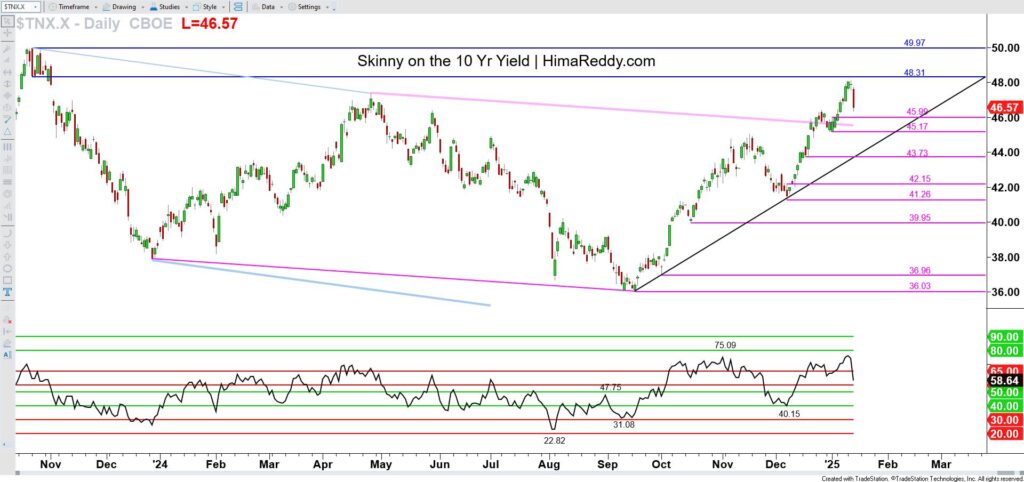
RIGHT CLICK CHART AND OPEN IN NEW TAB TO ENLARGE CBOE 10-Year Treasury Note Int Rate (TradeStation: $TNX.X) / DAILY CHART
OUTLOOK
Yields have been rising from 36.03 per the 41.26 Swing Low. They are correctively pulling back after the latest approach to 48.31, the low end of the important Oct 23 ‘23 daily chart range which sits just under the key 50.00 level.
Scope exists for yields to continue lower into Tue Jan 21. However only a move below 45.17 would risk 43.73.
The more likely scenario is that yields regroup and resume higher toward 48.31, which would keep them on track for a forecast toward 50.28 by Fri Feb 7th.
$TNX.X | KEY LEVELS
53.16 – June 2007 high
52.01 – July 2007 high
49.97 – Oct 23 ‘23 High
48.31 – Oct 23 ‘23 Old Low
“Resistance” Above
Current: 46.57
“Support” Below
45.99 – Old High of Jan 2 range
45.17 – Jan 2 ‘25 Price Low
43.73 – Dec 17 ‘24 Bar Low
42.15 – Old High of Dec 6 Low
41.26 – Dec 6 ‘24 Swing Low
39.95 – Oct 16 ‘24 Doji Low
36.96 – Oct 1 ‘24 Dragonfly Doji Low
36.03 – Sep 17 ‘24 Low


Leave a Reply