
Over the weekend, the war in Iran that started on February 28, 2026 officially became more than six months old. And with the latest strikes by the U.S. and continued issues in navigating the Strait of Hormuz, I unfortunately do not think it’s going to be resolved anytime soon.
So here’s what I think this means for your trading, especially if you trade index futures, stocks, or related ETFs.
How I’m Incorporating Oil Into My Routine
I think you need to start paying real close attention to oil. And here’s how I’m incorporating that into my routine.
Every time I sit down to write my Skinny on the Mini as part of the ES Futures Outlook service, I look at the overnight price action of the ES itself.
Then I check out the news (my go to site is CNBC). I check to see what, if any, headlines about the war are out and specifically what they may be doing to the price of oil futures.
And from there, I actually look at the oil chart. I use the continuous contract, symbol CL, in TradeStation.
Currently, that’s reflecting the October contract prices, but it’s important to note that oil futures are different than index futures in that they have 12 different contract months, not four contract months like index futures do. So the action in CL changes fast, which is why it’s easier to follow the continuous contract when you’re just using it as a directional observation and not trading it.
What I’m Watching Right Now on Oil Futures
Now, I am looking at the current daily chart, as you can see here.
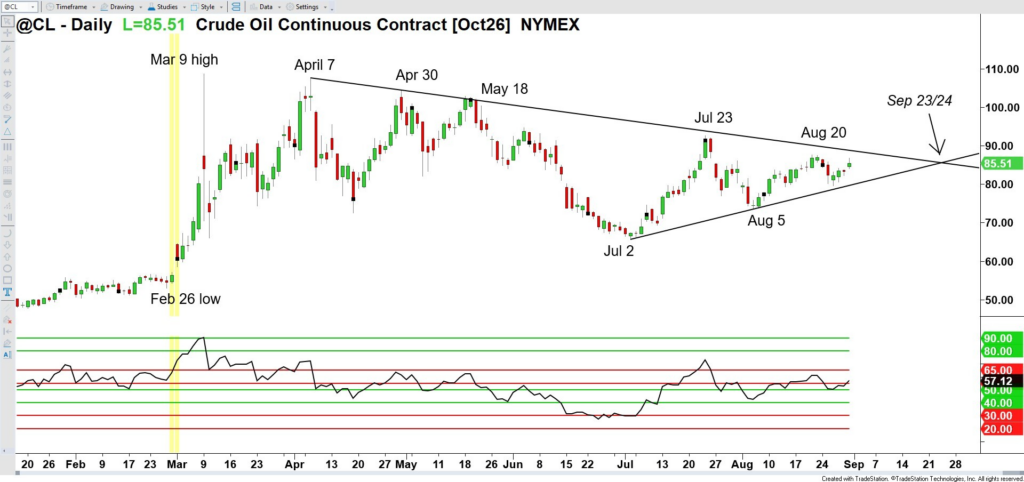
I have identified with yellow vertical lines the starting point of the war. Since it happened on a Saturday, it was between trading days, Friday, February 27 and Monday, March 2. And you can see how things have unfolded since.
Oil peaked at its March 9 high. Since then, there have been two converging trend lines (one rising, one falling) that have been useful in anticipating the price action. And right now, with the latest US strikes on Iran, the price of oil futures has ticked higher and is potentially looking for a return to the August 20 high.
Note that out on September 23 and 24 is where the two trend lines intersect. That suggests that those dates may include high volatility or dramatic price moves. It’s not a guarantee, just a guidelines.
It could also hint that a breakout from the converging trendlines will happen by then. Obviously, my hope is that the breakout is to the downside, as that would likely be reflective of less political and trade turmoil. If the price of oil futures is coming down, it’s usually because there’s no longer as much of a threat to the supply in the area or a threat to that supply getting out to other parts of the world. Which usually means that on the war front, there’s not a lot happening.
These are the trend lines I’m going to monitor, and I am looking at the action of each candle each day on oil futures.
Why This Matters If You Trade Stocks
I think this is important for you to consider looking at daily as you navigate stocks, index futures, and ETFs. Because, like I said, unfortunately, I don’t think this war is going to end any time soon.
Checking in on the oil futures chart can give you a little bit of a directional heads-up to the broad market, like the S&P 500. It’s not a hard-and-fast rule, but generally when oil prices are rising these days, stock index prices will be falling.
Again this is something to keep as an extra guideline. Make sure you follow your trading plan and your trading strategies above all.
🚨 PS — Weekly Trading Show TOMORROW 🚨
Be sure to join me at Ticker Request Live for our 32nd broadcast on Tue Sep 1 at 4:30 PM ET!
👉 You can register here to join me in the Zoom room: himareddy.com/tickerrequestlive
📺Or catch the livestream here: https://www.youtube.com/@himareddycmt/streams
Check out ALL of our events at himareddy.com/events

Leave a Reply