What a spring it’s been! It started off with the announcement of huge tariffs on April 2nd. Broad markets plummeted, stabilized, consolidated, and then clawed their way up again.
Now it’s all still pretty early, but we do know that there’s a 90-day pause on sky-high tariffs – that’s something. Here’s the thing: I don’t think that the volatility is over just because there’s been some progress made with our biggest adversary when it comes to trade. This is a step in the right direction, and there’s still a road ahead.
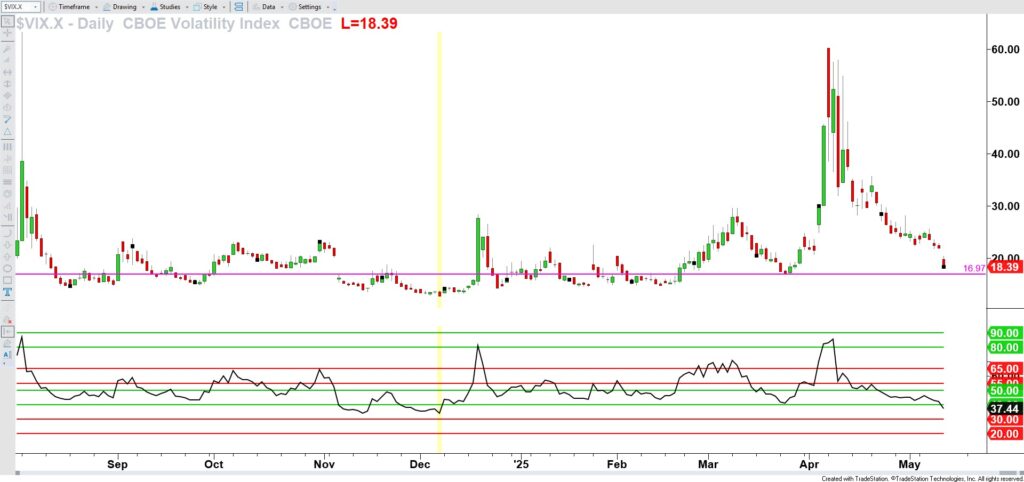
CBOE Volatility Index (TradeStation ticker $VIX.X) / Mon May 12, 2025 / 5:14 PM Eastern Time / DAILY CHART
What I’m using to help me better prepare for trading each day is the VIX. This isn’t new, especially if you’re an options trader, but it’s something you should monitor no matter what you trade. Let’s look at the VIX daily chart above. It’s actually moving back towards the low from Monday March 26. More interestingly, for the first time in a few months, the daily chart reading for the RSI Power Zones on the VIX has moved below the Bull Support Power Zone. You can see that when this happened back in November-December 2024 (yellow vertical line marks Dec 6), it didn’t stay down for long before the VIX popped higher. I can go into this deeper if I apply Advanced RSI Power Zones techniques, but for now, let’s just say there are a couple of things to watch.
First off, just because the RSI Power Zones on the daily chart of the VIX have moved below the Bull Support Power Zone, it does not guarantee that momentum indicator will fall all the way to the Bear Support Power Zone. We’ve got to look at the candlesticks on the VIX to see what’s happening as well.
And right now, the most critical daily range on the VIX is the candlestick from March 26th. If we drop below that 16.97 value, that would fuel the current move higher in the broad market for a bit. However, if the March 26 low on the VIX holds and the VIX starts to turn higher, also considering the position of the daily RSI Power Zones on the VIX, that would not be good for the stock market.
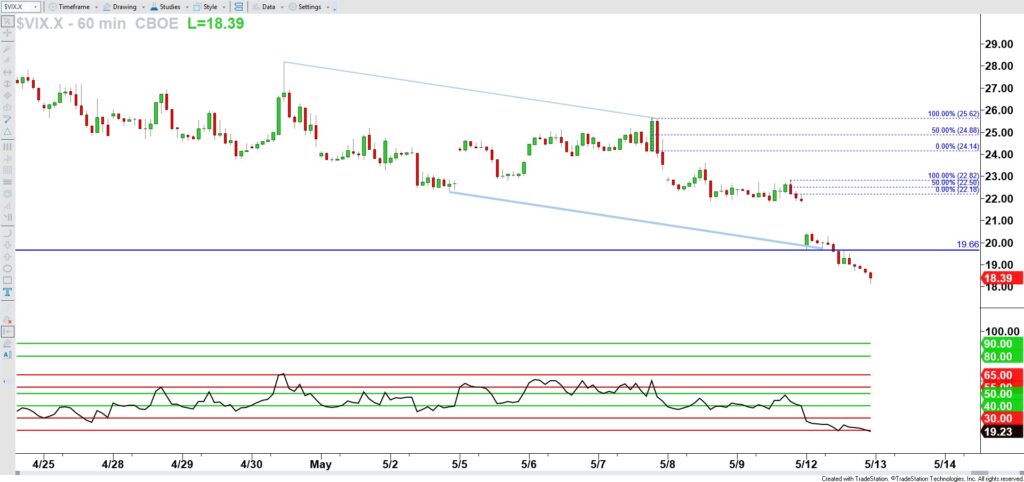
CBOE Volatility Index (TradeStation ticker $VIX.X) / Mon May 12, 2025 / 5:15 PM Eastern Time / 60-MINUTE CHART
Dialing down to the 60-minute chart, you can see the situation is already oversold. However, just because the RSI Power Zones get to the Bear Support Power Zone doesn’t mean they can’t go lower. Remember, the RSI Power Zones just like the traditional RSI has a range from 0 to 100, there’s plenty of room to move lower from 19.23 down towards 0.00.
What I would monitor is the high at 19.66. If the VIX starts to get above that in the next day or two, again we could see some unwinding of the pop higher in stocks that followed weekend’s initial negotiations.
This is a reminder to keep a tab on the VIX no matter what you trade. I’ll continue to monitor it for myself and share updates on it in our various group coaching sessions, including my Candlestick Tune Up Live this Wed May 14th for our Gann Candlestick members, our Wed May 28th Advanced Monthly Group Coaching, and my weekly S&P Edge Pro Futures Trading Labs along the way.
Catch you on the inside,
~Hima
PS Check out our full events calendar by visiting himareddy.com/events anytime
Leave a Reply