
Skinny on the SPY: Mon May 22, 2023

CLICK IMAGE TO ENLARGE IN NEW TAB SPDR S&P 500 ETF Trust (TradeStation: SPY) / Mon May 22, 2023 / 4:00 PM Eastern Time / DAILY CHART
PRIOR COMMENTARY
In the Q1 2023 Edition of the Skinny Outlook reports published Sun Jan 8, 2023 I wrote:
<<
Shares have been consolidating since Dec 16 ‘22. With the RSI attempting to base in the Bull Support Power Zone, scope exists for an upside breakout into the 411.73 – 419.96 coinciding with a Forecast Cloud (Advanced Lost Forecasting technique).
Dips may delay, but only a push below 368.79 would risk a return to the 348.11 low of 2022.
>>
RECAP
Shares did trade up into 411.73 (Sep 12 ‘22 high) capping at 418.31 (Feb 2 high) just shy of 419.96.
Shares then corrected lower to 380.65 (Mar 13 low) before trading up to 415.72 (Apr 18) and consolidating.
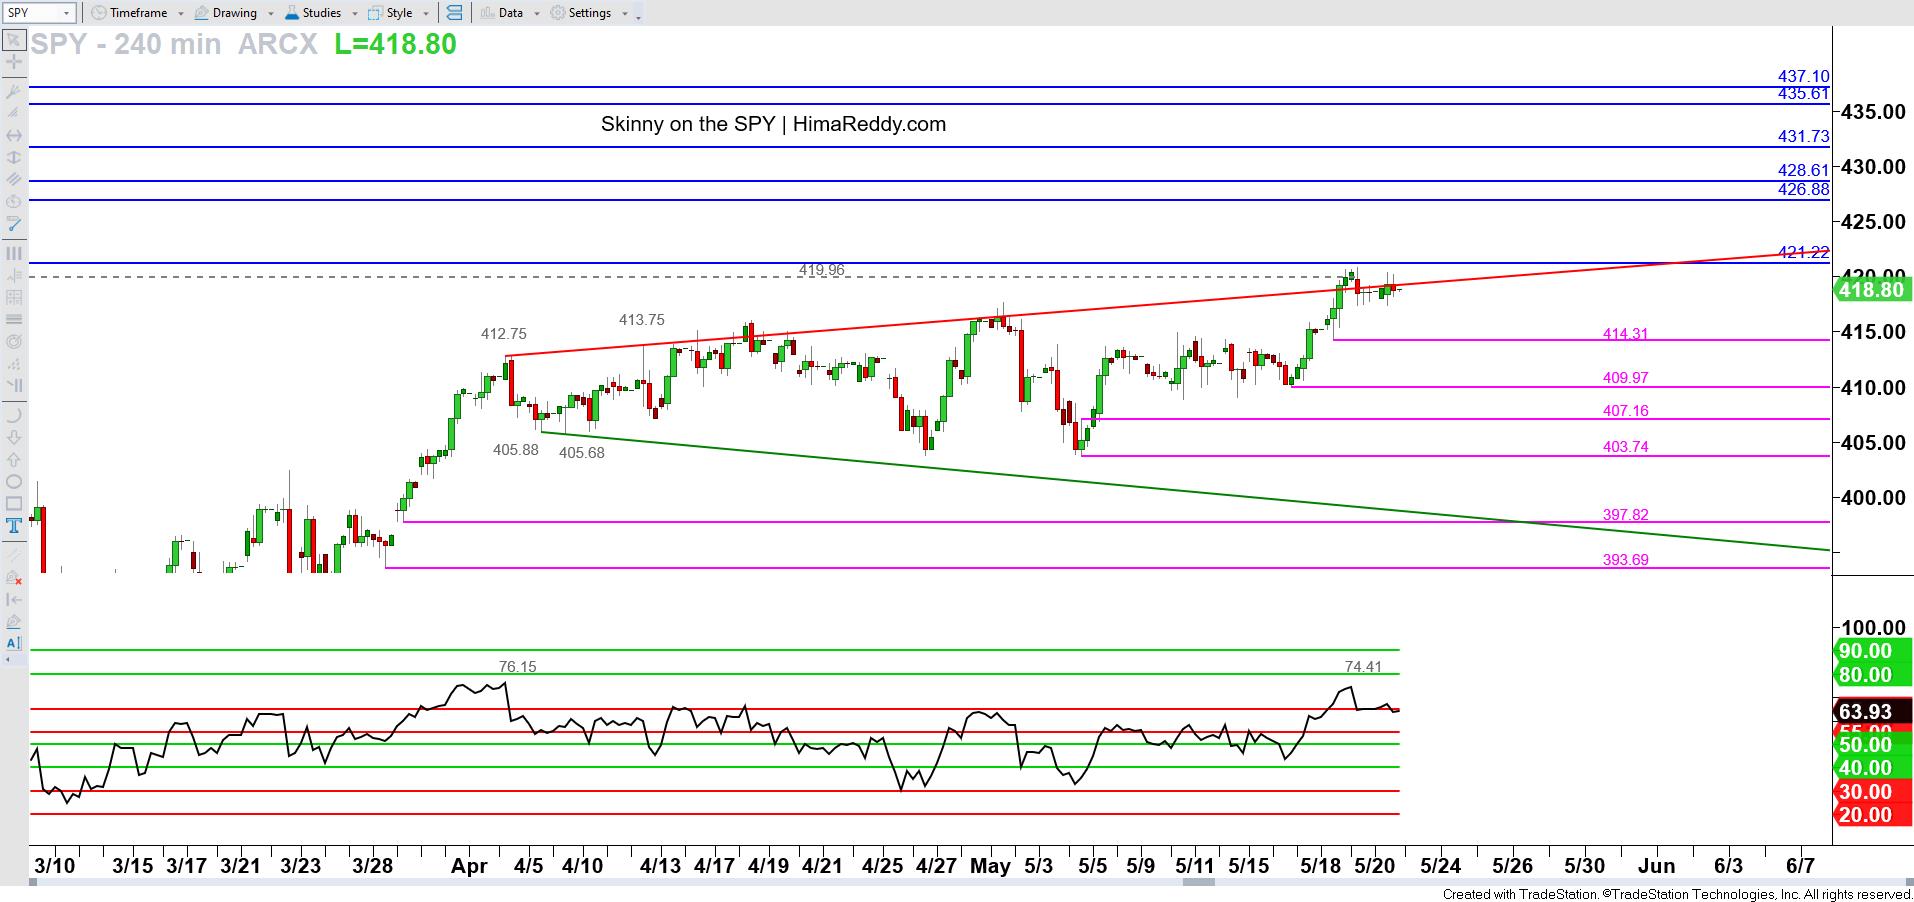
CLICK IMAGE TO ENLARGE IN NEW TAB SPDR S&P 500 ETF Trust (TradeStation: SPY) / Mon May 22, 2023 / 4:01 PM Eastern Time / 240 MINUTE CHART
OUTLOOK
After several weeks of consolidation, shares broke higher to pierce 419.96 (Aug 26 ‘22 high). RSI Power Zones on the 240-min chart is at a pause point after posting a possible Historical Hold (Advanced RSI Power Zones technique).
The outlook remains for shares to trade higher. The next upside target is 426.88 ahead of the 431.73 Swing High. Dips may delay, but only below 409.97 would defer toward 403.74.
SPY | KEY PRICE LEVELS
450.01 – Apr 21 ‘22 high
446.78 – nano level Apr 21 ‘22 Nano Large Red Candle
443.56 – nano level Apr 21 ‘22 Nano Large Red Candle
440.33 – nano level Apr 21 ‘22 Nano Large Red Candle
437.10 – low of Apr 21 ‘22 Nano Large Red Candle
435.61 – Apr 18 ‘22 Old Bottom
431.73 – Aug 16 ‘22 Swing High
428.61 – Aug 18 ‘22 Bar high
426.88 – low of Aug 16 ‘22 Price Spike
421.22 – Aug 19 ‘22 pre-gap low
Resistance Above
Current price: 418.87
Support Below
409.07 – Fri May 12 low
407.16 – high of 240 min Price Low
403.74 – Thu May 4 low
397.82 – 240 min Bar Low
393.69 – Tue Mar 28 low
389.33 – 240 min Price Low
385.18 – 240 min Price Low
380.49 – 240 min Price Low
SHORT-TERM TRENDLINE DETAILS (BASED ON 60 MIN CHART)
Red Rising Trendline resistance, joins 412.75 and 413.75 highs
Green Falling Trendline support, joins 405.88 and 405.68 lows
Hima Reddy, CMT
Copyright © 2023 Celer Wealth LLC, All rights reserved.
