Skinny on the SPY: Mon Jun 26, 2023
Here’s your Skinny On The SPY for the week ahead.
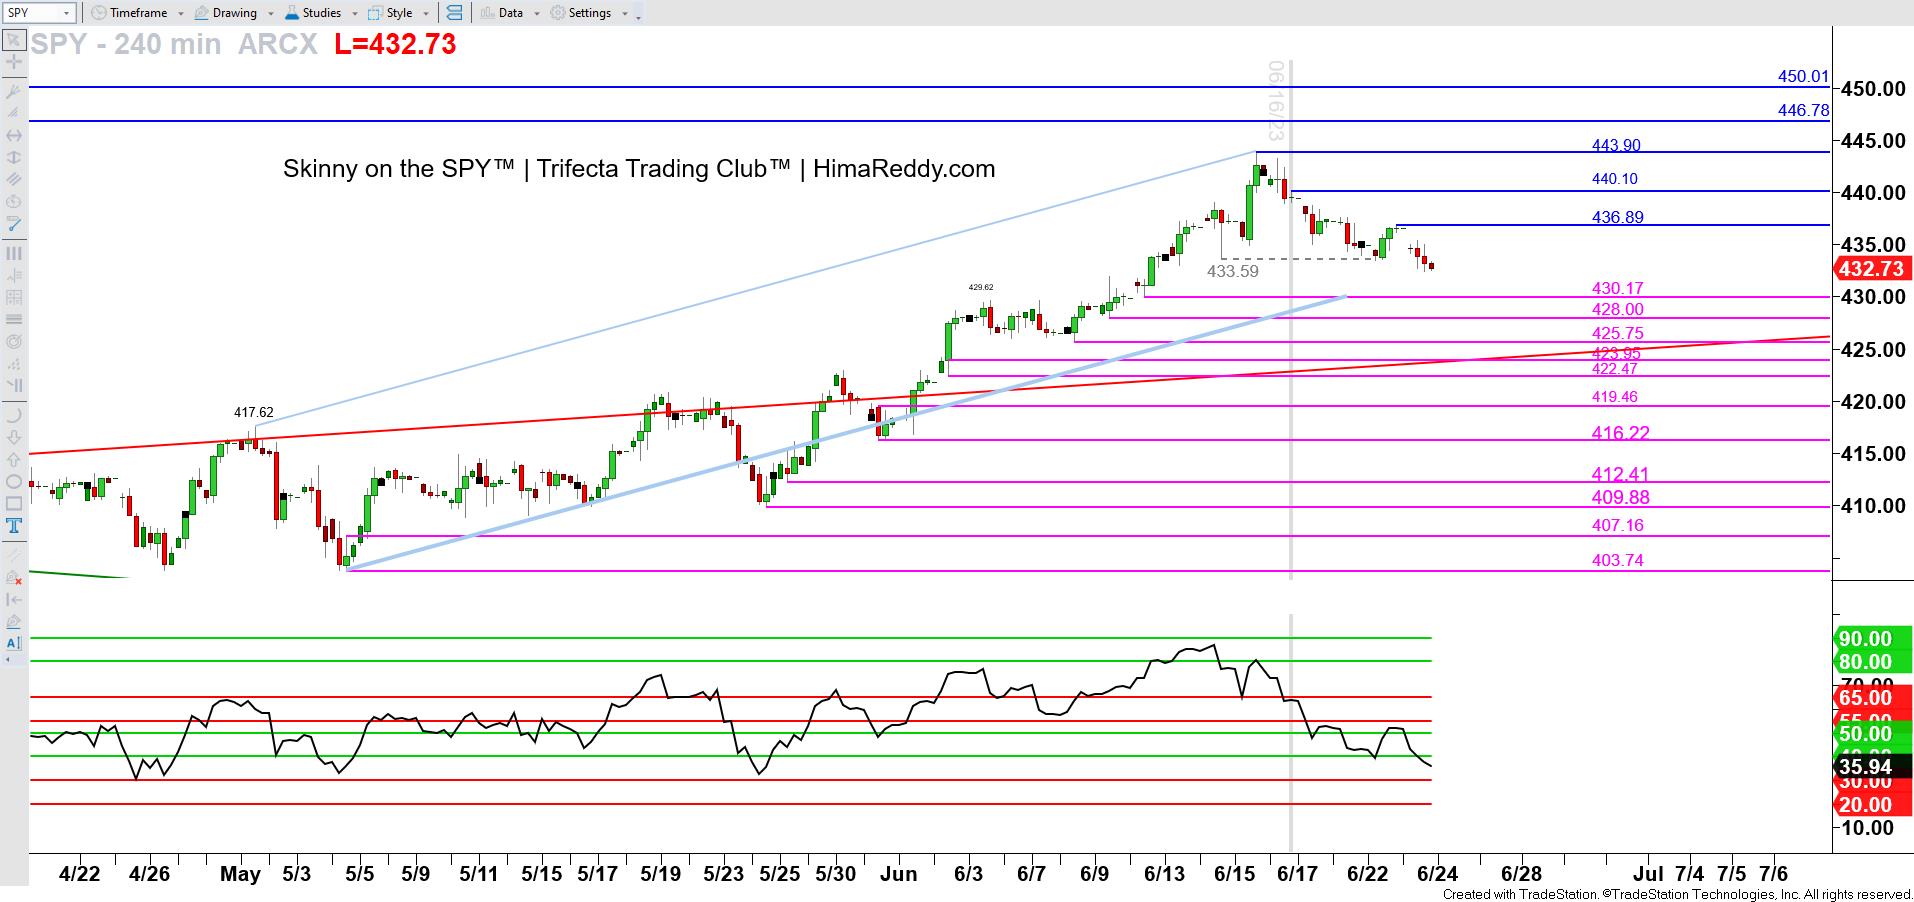
SPDR S&P 500 ETF Trust (TradeStation: SPY) / Sun Jun 25, 2023 / 240 MINUTE CHART
PRIOR COMMENTARY
On Mon Jun 19 (gray vertical line marks end of day Friday), I wrote:
<<
On Price
- Pattern: the price action on Friday versus Thursday formed a Dark Cloud Cover Candle pattern.
- Level: This was after testing the midpoint of the Apr 21 ‘22 Nano Large Red Candle.
On Timing
- On the daily chart, shares have exceeded the price aspect of an Advanced Forecast (Mar 13, May 1, May 4th), but the key timing point remains (Thu Jun 22), providing room for volatility
On Momentum
- And on the 240–minute chart the RSI Power Zones posted a Bearish Divergence in the Bull Resistance Power Zone.
Therefore, the outlook is for shares to weaken into this week before longer-term bulls might resume. Below 438.03 would risk 434.92 – 433.59 ahead of the key 430.17 (near 429.62 Old Tops).
If instead bulls resume higher first, the next upside target would be 450.01. A push above would promote 457.83 – 459.63.
>>
RECAP
Shares did weaken on Tuesday through Friday, breaking below 433.59 (Wed Jun 14 low) to expose the key 430.17 (near 429.62 Old Tops).
OUTLOOK
On Timing, shares are correcting lower in line with an Advanced Forecast (May 1, May 4, Jun 15) that has passed its time (Tue Jun 20) but has room for price to move lower (430.02).
Therefore the outlook is for shares to continue lower into the key 430.00 area. If they can form a tradeable low there and return higher, above 436.89 would refuel back toward the 443.90 Swing High.
However if shares continue to weaken and push below 430.17, I’d watch out for losses toward 422.47 next (near May 30 Old Top).
SPY | KEY PRICE LEVELS
[remaining resistance levels detailed in full report in Trifecta Trading Club portal]
443.90 – Thu Jun 15 high
440.10 – intraday lower high
436.89 – intraday lower high
Resistance Above
Current price: 432.73
Support Below
430.17 – intraday higher low
428.00 – intraday higher low
425.75 – intraday higher low
[remaining support levels detailed in full report in Trifecta Trading Club portal]
SHORT-TERM TRENDLINE DETAILS (BASED ON 60 MIN CHART)
Red Rising Trendline resistance, joins 412.75 and 413.75 highs
Green Falling Trendline support, joins 405.88 and 405.68 lows

