Skinny on the SPY: Mon Aug 28, 2023
Here’s your Skinny On The SPY for the week ahead.
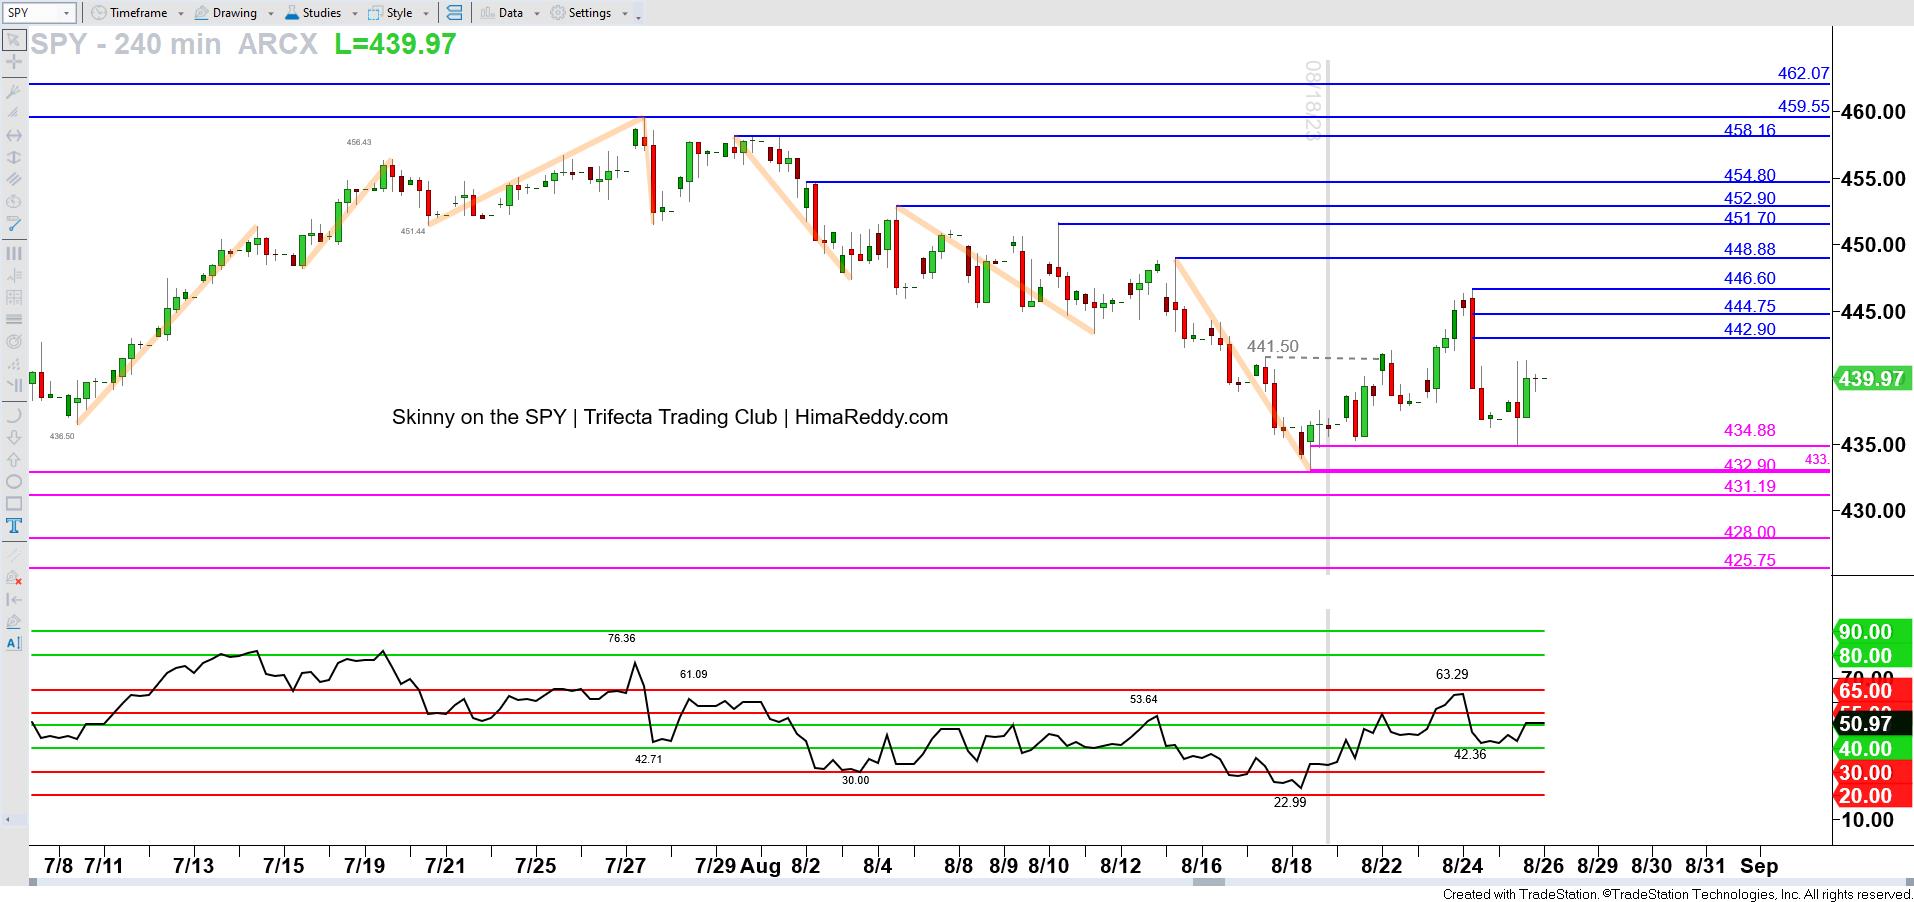
Click chart to enlarge and open in new browser tab SPDR S&P 500 ETF Trust (TradeStation: SPY) / Sun Aug 27, 2023 / 240 MINUTE CHART
PRIOR COMMENTARY
On Sun Aug 20 (gray vertical line marks end of day prior Friday), I wrote:
<<
On Price, shares have returned to the Jun 26 Price Low, rebounding intraday after approaching its midpoint.
On Momentum, 240-min RSI has fallen to the Bear Support Power Zone and is working off oversold conditions.
On Timing, there’s an Advanced long-term Forecast per the weekly chart (Feb 3, Mar 17, Jul 28 weeks) offering scope for further downside into early September.
Therefore, the outlook is for shares to continue lower toward 431.19. Losses there would risk 425.75 next.
Recovery gains may delay, but only above 441.50 would offer relief, toward 444.33 initially.
>>
RECAP
Shares traded higher, moving above 441.50 on Tuesday. They continued to 446.60 before falling sharply lower to 435.00 on Friday.
OUTLOOK
Looking at Price Action, last week’s candlestick completed as an Inside Bar. On the Daily chart, shares have most recently held support at 435.29, the midpoint of the Fri Aug 18 range.
Analyzing Momentum via the RSI Power Zones, 240-min RSI is attempting to resume higher after holding the Bull Support Power Zone. But Red Zone Domination has been in effect since late July (see 61.09 peak).
And when deploying Market Timing, there’s still an Advanced long-term Forecast per the weekly chart (Feb 3, Mar 17, Jul 28 weeks) offering scope for further downside into early September.
Therefore, the outlook in the short-term is for further upside, towards 448.88. However clearance above that level would be required to reset longer-term bulls. I think the more likely scenario is that short-term bears reassert pressure while beneath 448.88 for a move down toward 431.19.
SPY | KEY PRICE LEVELS
[remaining resistance levels detailed in full report in Trifecta Trading Club portal]
446.60 – intraday high
444.75 – nano level 240-min Nano Large Red Candle
442.90 – nano level 240-min Nano Large Red Candle
Resistance Above
Current price: 439.97
Support Below
434.88 – midpoint 60 min Price Low
433.01 – Fri Aug 18 low
432.90 – midpoint Jun 26 range
[remaining support levels detailed in full report in Trifecta Trading Club portal]

