The Relative Strength Index — or RSI — is one of the most well-known technical tools in trading. Almost every trader hears about it early on, yet many don’t fully understand how to use it.
For me, RSI isn’t optional. It’s something I use every single time I trade and every single time I analyze a chart. But the way I use it might not be what you expect.
How I Use RSI in My Trading
I focus on my RSI Power Zones approach. That’s the backbone of how I use this indicator.
But I always keep in mind the way RSI was originally designed. The creator of RSI wanted to help traders stay out of trendless or choppy markets.
So in those situations — when price action is contracting into a tight range, expanding like a megaphone, or just swinging wildly with no clear trend — the traditional 70/30 levels for overbought and oversold can actually be useful.
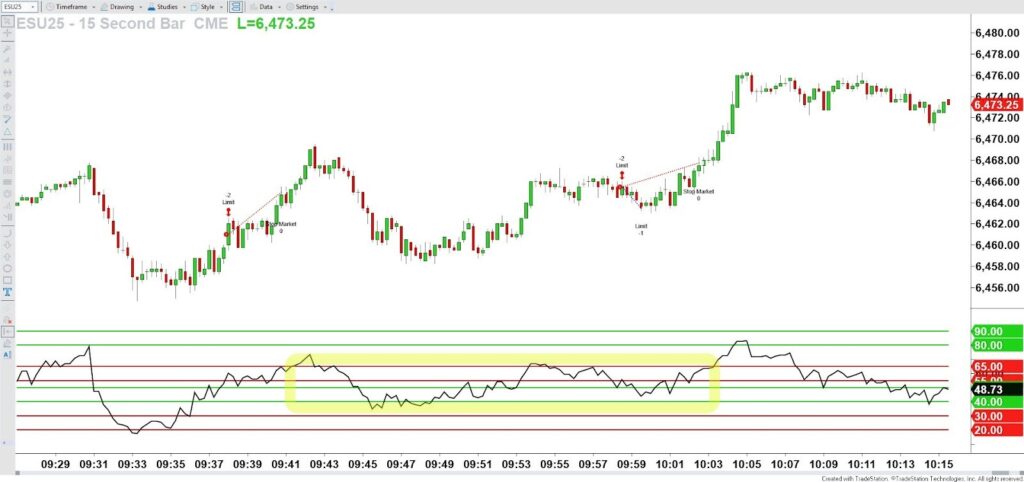
Here’s an example of an E-mini S&P 500 futures action on a 15-second candlestick chart (regular candles, not Heiken Ashi). See that yellow highlight box on the RSI Power Zones? It shows the churn that the RSI went through before breaking out and extending to the Bull Resistance Power Zone like I teach (see Winning RSI Playbook). And that churn was basically between the 70 and 30 traditional levels.
In sideways markets, those classic levels can give you helpful clues. But when markets are clearly trending, I lean on my Power Zones method.
What Traders Often Get Wrong About RSI
One of the biggest mistakes I see is that traders treat RSI like a one-size-fits-all signal. They think: above 70, sell. Below 30, buy.
That’s not how momentum works best.
The usefulness of RSI — or any momentum indicator — depends on the price trend of that same security. It’s not safe to trade on RSI alone, because momentum indicators are calculated from price itself.
If you ignore price action and just trade the indicator, you’re missing half the “story”.
Pairing RSI With Price Action
I never trade RSI in isolation. I always look at what price action is doing alongside it.
That’s why in my Four Zones RSI Coverage System, I also teach ways to identify and trade price support and resistance. Momentum and price go hand in hand.
Think of it like a couple — momentum and price have to work together to create a real setup.
For me, that pairing might include candlestick patterns, key levels on the chart, or broader price zones. RSI helps confirm or challenge what price action is already showing.
Quick Wins for Using RSI Right Now
If you want to start improving how you use RSI, here are a couple of practical steps:
- Plot the indicator on your charts. I primarily use my RSI Power Zones to trade the15-second chart, but I also apply it to analyze higher timeframes like 3-minute, 60-minute, daily, and weekly.
- Pay attention to turns. Notice how RSI often turns before price does. It doesn’t happen on every swing, but it’s common enough to watch closely.
- Review past momentum vs. price behavior. Even if you’re looking back on old trades, see how RSI lined up with your entries and exits. If you’ve studied my RSI systems, practice spotting the signals I teach and bring them to group coaching for feedback.
The key is to treat RSI as part of a bigger picture, not a standalone “buy/sell” button.
Bringing It All Together
RSI has stood the test of time because it works — but only when you use it correctly.
For me, that means focusing on Power Zones, respecting price action, and remembering that momentum indicators are only as good as the context you apply them in.
If you’re curious to go deeper, check out some of my past blogs on RSI. And if you’re already using RSI, I’d love to know — how are you applying it in your trades right now? Share in the comments below.
~Hima
👉 PS — Events Calendar Update
The Trader Training calendar has been updated! Here’s what’s on deck:
- Hima at the Wealth365 Summit
📅 Tuesday, January 20 at 10:00 AM ET - Ticker Request Live — free weekly trading show
📅 Tuesday, January 20 at 4:30 PM ET
Visit himareddy.com/events for full details and registration.

Leave a Reply