
That’s right, we’re looking at a long-standing S&P 500 component versus a brand new company with big hype. For both it’s all about price action, market timing, and momentum. Let’s go!
Advanced Micro Devices, Inc. (AMD)
AMD is a longstanding S&P 500 component (briefly demoted in 2013, then back in 2017). It might be the most important semiconductor earnings report of the week, the key AI-hardware datapoint after Microsoft, Amazon, and Meta all confirmed heavy AI spending. Among the news to watch for is whether its data-center and MI-series GPU numbers justify the AI-demand narrative. It reports after the close on Tuesday August 4th. Here’s my take on the chart captured today around 11 AM ET.
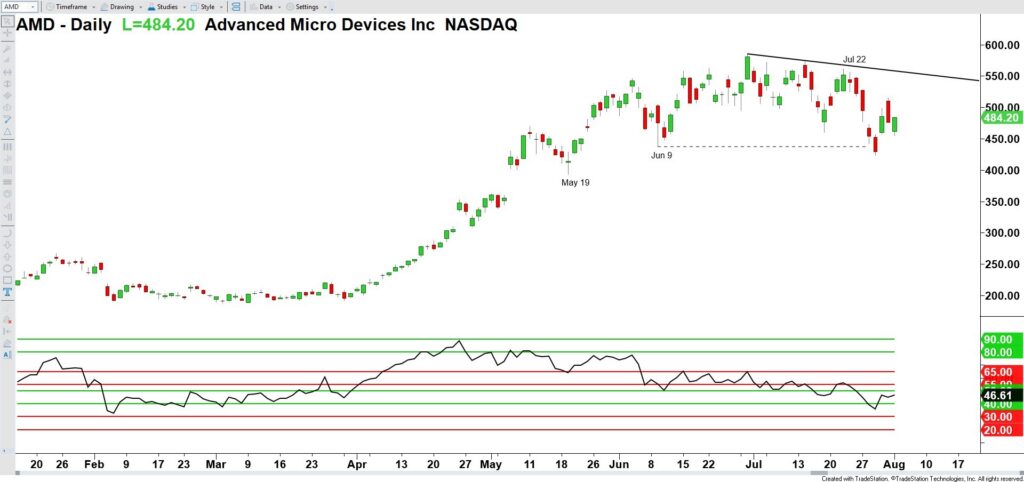
Shares of AMD are higher off the recent Jul 29 low which tested the key Jun 9 low but didn’t sustain a break below (no daily closing session beneath 437.23). This was after a long extended period of working off overbought conditions (since April 24 most extreme peak).
So heading into earnings it is my opinion that AMD will trade higher back toward the Jul 22 high, also near a short-term falling trendline.
If shares instead trade lower from there, the next short-term downside target would be the May 19 low at 393.36.
SpaceX (SPCX)
Now, SpaceX is having its first-ever earnings report as a public company. First prints from a company that big and that hyped always draw a crowd regardless of the numbers, and the Musk factor amplifies it.
Analysts are actually expecting a loss (around -$0.29 on ~$6.8B revenue), so the interest is more about the debut and the guidance than a clean beat.
NOTE SPCX just IPO’d on June 12, and it isn’t in the S&P 500 yet which is my main list of companies I watch for earnings. So it won’t be in my ES Futures Outlook earnings list tomorrow but I mean it’s arguably the buzziest name of the day. Here’s my take on the chart.
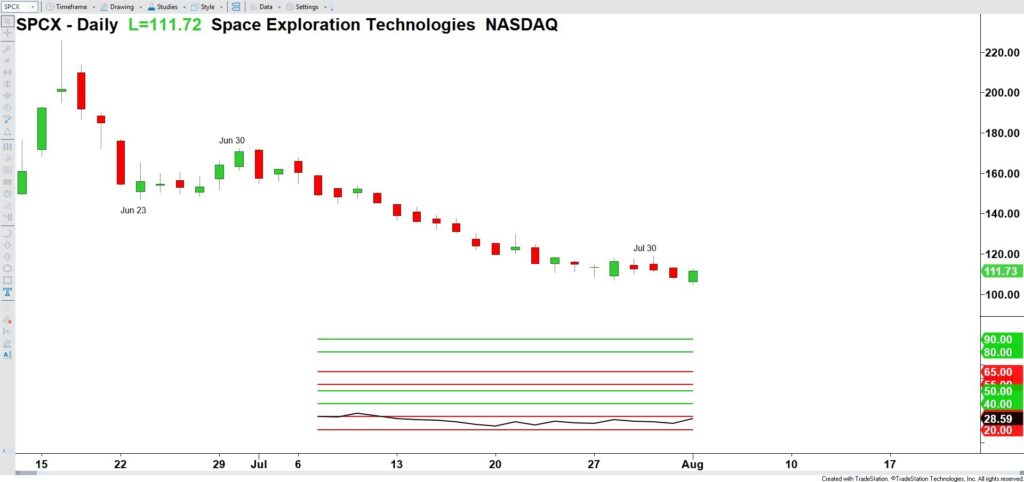
Alright so for those of you not used to “new charts”, you do not need to rub your eyes. There is white space early in the RSI Power Zones because as I teach in the Winning RSI Playbook it’s a 14-period indicator. So on a daily chart, with SPCX having IPO’d on June 12, there was not enough data to calculate an RSI value until July 7, which is the first RSI reading on the chart.
Looking at the recent price action, shares pushed down below 105.00 intraday here on Monday and are attempting to recover. The RSI has been rising since posting a trough on July 20 at 22.72, but it’s still been in Bear Support Power Zone.
So while there’s some recovery in motion to the upside, I’d need to see a closing daily session break above the July 30 high at 118.93 to get “excited” about this stock from a reaccumulation perspective. Even then, the next short-term upside target would be the Old Bottom at 147.11 from Jun 23.
If shares of SPCX remain in their downtrend, they may play into a forecast for shares to trade down to 96.06 by Thu Aug 6.
🚨 PS — Weekly Trading Show TOMORROW 🚨
Be sure to join me at Ticker Request Live for our 29th broadcast on Tue Aug 4th at 4:30 PM ET!
👉 You can register here to join me in the Zoom room: himareddy.com/tickerrequestlive
📺Or catch the livestream here: https://www.youtube.com/@himareddycmt/streams
Check out ALL of our events at himareddy.com/events


Leave a Reply