Earnings release day, and the few days that the market digests the move after, are JUST the beginning.
Whether you trade NVDA action, or follow the related industry or sector ETFs, this company has been a major player in the AI space and should be observed so that you can be best prepared for direct or related market moves. So here’s my completed analysis on Nvidia in my “Skinny” style format including an explainer video:
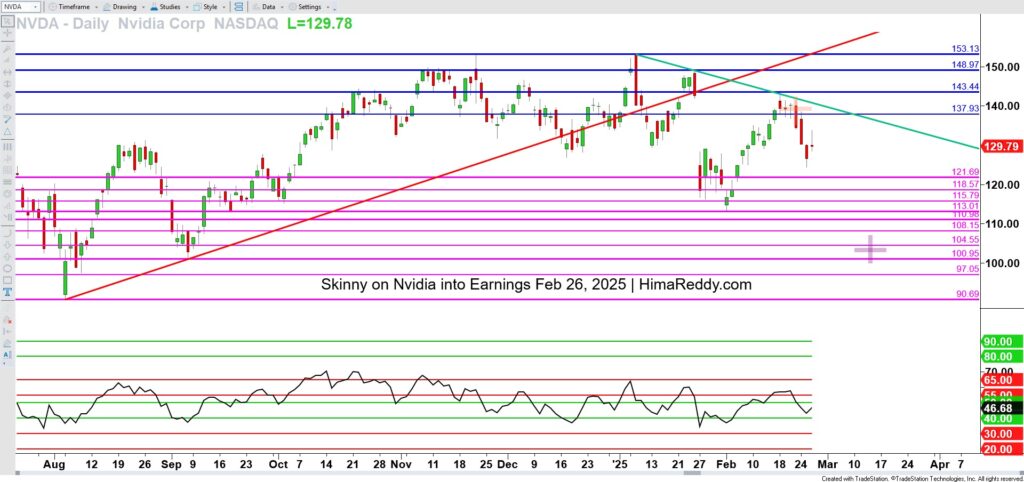
RIGHT CLICK CHART AND OPEN IN NEW TAB TO ENLARGE Nvidia Corp (Ticker NVDA) / Wed Feb 26, 2025 / 2:56 PM Eastern Time / DAILY Chart
OUTLOOK
Shares peaked at 153.13 and declined to 113.01 before recovering to 143.44. Shares have been lower since.
The outlook is for further downside. The initial downside target is 115.79 (near shorter-term forecast). Losses there, pushing below 113.01, would risk 104.55 (near longer-term forecast).
If instead shares trade higher from current levels, above 143.44 would be required to put the focus back on the 153.13 all-time high.
NVDA | KEY PRICE LEVELS
153.13 – Tue Jan 7 Swing High
148.97 – Fri Jan 24 Price High
143.44 – Feb 18 Swing High
137.93 – Old Low of Feb 18 range
Resistance Above
Current price: 129.84
Support Below
121.69 – midpoint week ending Feb 7 range
118.57 – Old High Mon Feb 3 range
115.79 – midpoint Feb 3
113.01 – Feb 3 Price Low
110.98 – midpoint Aug 2024 monthly range
108.15 – Old High Sep 6
104.55 – midpoint Sep 6 range
100.95 – Fri Sep 6 low
97.05 – midpoint Mon Aug 5 range
90.69 – Aug 5 Price Low
Hima Reddy, CMT
Copyright © 2025 Celer Wealth LLC, All rights reserved.


Leave a Reply