We're just two days out from election day. And no matter which candidate wins the presidency – alongside how Congressional control unfolds – there are likely to be some wild market moves.
While I'm not tossing my tried and true approaches to the market out the window, I am shaking up what I analyze and trade in addition. To start with, I'm going deeper on the VIX, the CBOE Volatility Index. It's essentially the fear gauge of the markets. When the VIX is rising, the stock markets is generally falling, and vice versa.
Therefore ahead of what's likely to be a dramatic week, I'm sharing a Skinny on the VIX report with you. It's analysis on the VIX in my “Skinny” style that may be a useful guide as the action unfolds.

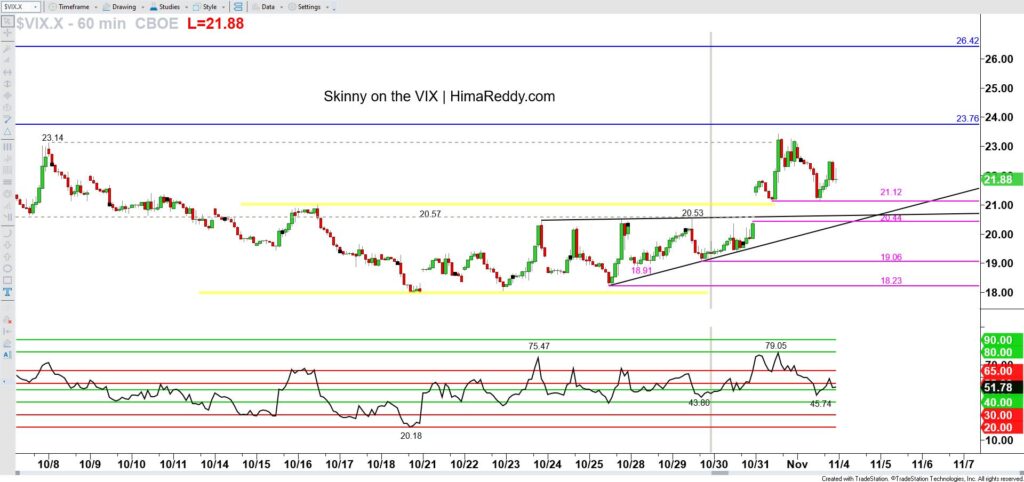
RIGHT CLICK CHART AND OPEN IN NEW TAB TO ENLARGE CBOE Volatility Index (TradeStation: $VIX.X) / Sun Nov 3, 2024 / 4:09 PM ET / 60 MINUTE CHART
PRIOR COMMENTARY
On Tue Oct 29 at 7:00 PM ET (gray vertical line marks that day’s market close), I shared with a select group of traders:
<<
The VIX has essentially been consolidating between the Oct 16 high at 21.01 and the Oct 18 low at 17.99 (see yellow highlights). Most recently, the VIX has moved lower from 20.53, after approaching the key 20.57 retracement a third time and backing off.
The outlook is for the VIX to continue lower from current levels. Below 18.91 would allow a return to 18.23-18.13 initially.
If instead the VIX moves higher from here, clearing 20.57 – 20.53 (60 min close basis) would reopen 21.01 initially.
>>
RECAP
The VIX edged higher on Wed Oct 30, then gapped higher on Thu Oct 31, moving up to 23.42. This coincided with the RSI Power Zones peaking at 79.05, skimming the Bull Resistance Power Zone. From there, the VIX dropped into Fri, holding at 21.16 so far.
OUTLOOK
While there’s scope for the VIX to move lower back toward the prior 21.01 range barrier, the outlook overall is for the VIX to resume higher, seeking 23.76.
If instead the VIX moves lower beneath 21.12, that would offer scope for 20.44 initially.
VIX | KEY LEVELS
29.47 – Thu Aug 8 high
26.42 – nano level Thu Aug 8 Inside Bar
23.76 – Fri Sep 6 high
“Resistance” Above
Current price: 21.88
“Support” Below
21.12 – Thu Oct 31 low
20.44 – intraday pre-gap high
19.06 – Tue Oct 29 low
18.23 – Fri Oct 25 low
PS: The upcoming election has me deploying a complementary trading strategy like nothing you've ever seen. I did a live event with a special guest revealing it on Tue Oct 29. And it provided a swing trading setup already! You can check out the strategy here while it's still available>>


Leave a Reply